


The affordability of higher education is vital for the accessibility of higher education. Unfortunately, much of the debate around affordability is conducted in terms simply of prices, and usually inflation-unadjusted ones at that. But while price is an input to affordability, it is not the whole story. In fact, it is exactly half the story: the numerator, if you will. The other half, the denominator, is capacity to pay. And yet for some reason we almost never bring this into the discussion.
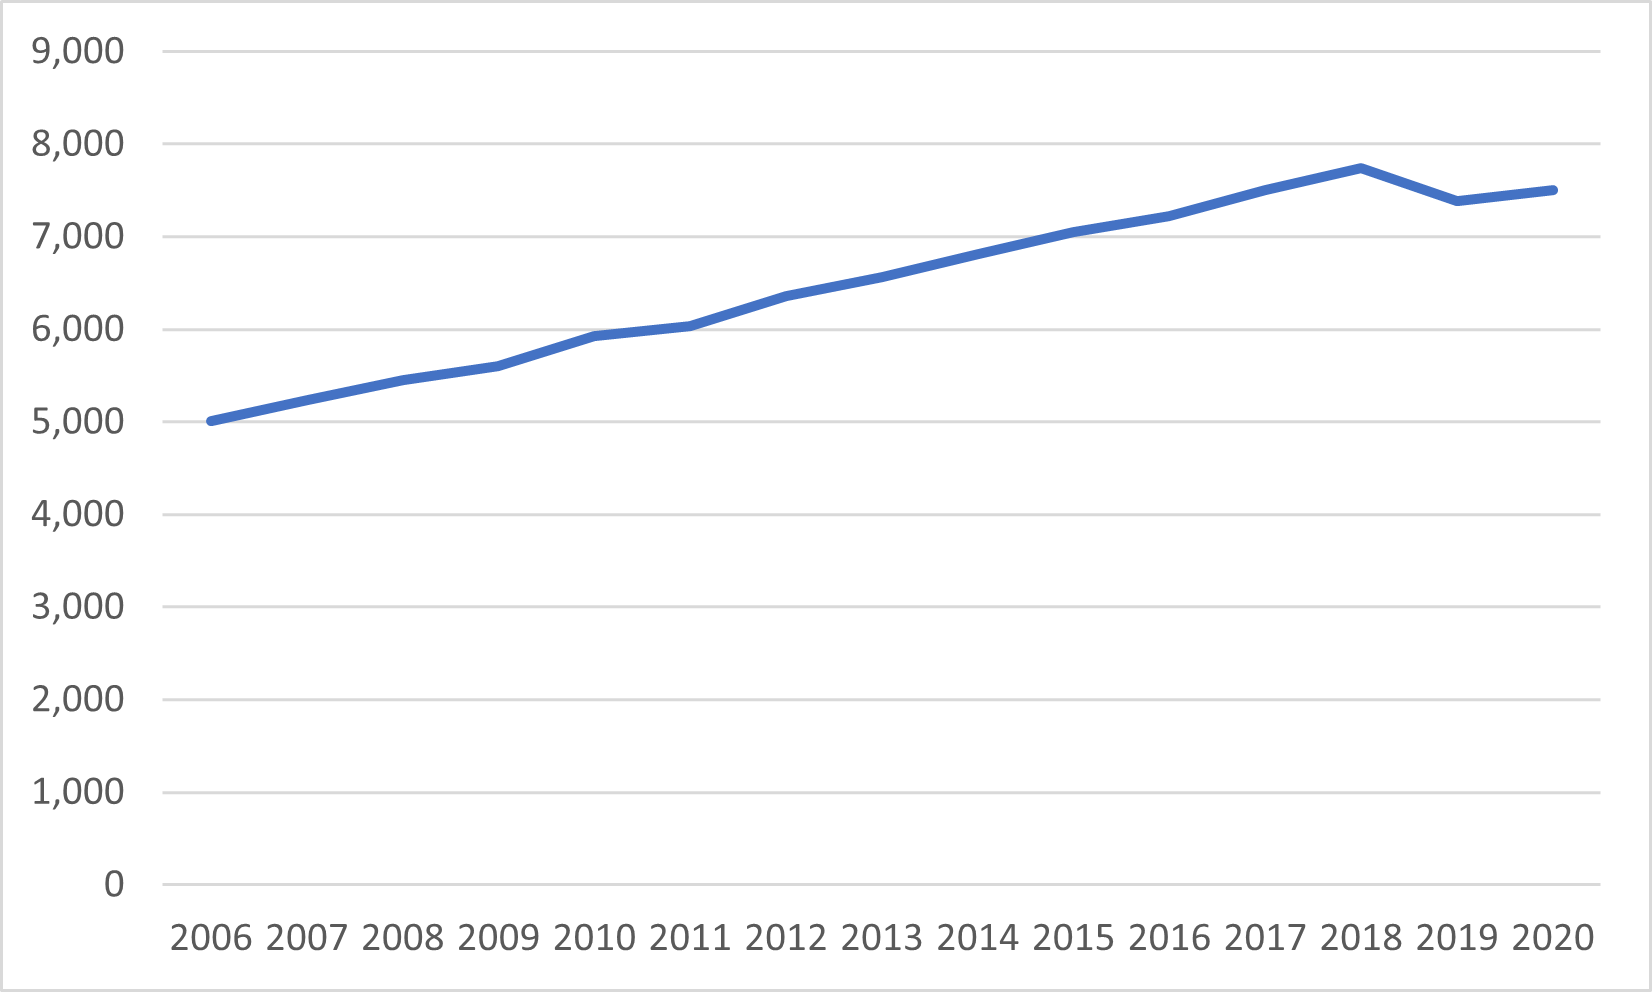
When it comes to affordability debates, what you’re probably used to is seeing a chart like Figure 1: tuition fees in unadjusted nominal dollars. Oh. My God: sky-rocketing fees, amirite (apart from the dip in 2019 which we are not allowed to mention because Doug Ford)? Disaster, catastrophe etc.
Figure 1: Average Undergraduate Tuition and Fees, Canada, in Nominal Dollars, 2006-2020
(College readers: I hate to break it to you, but I can only do this analysis for universities, a) because StatsCan does not collect data on college tuition, and b) because colleges themselves are often hostile to attempts by third parties to obtain the data necessary to calculate it independently. I know because I have tried. Sorry.)
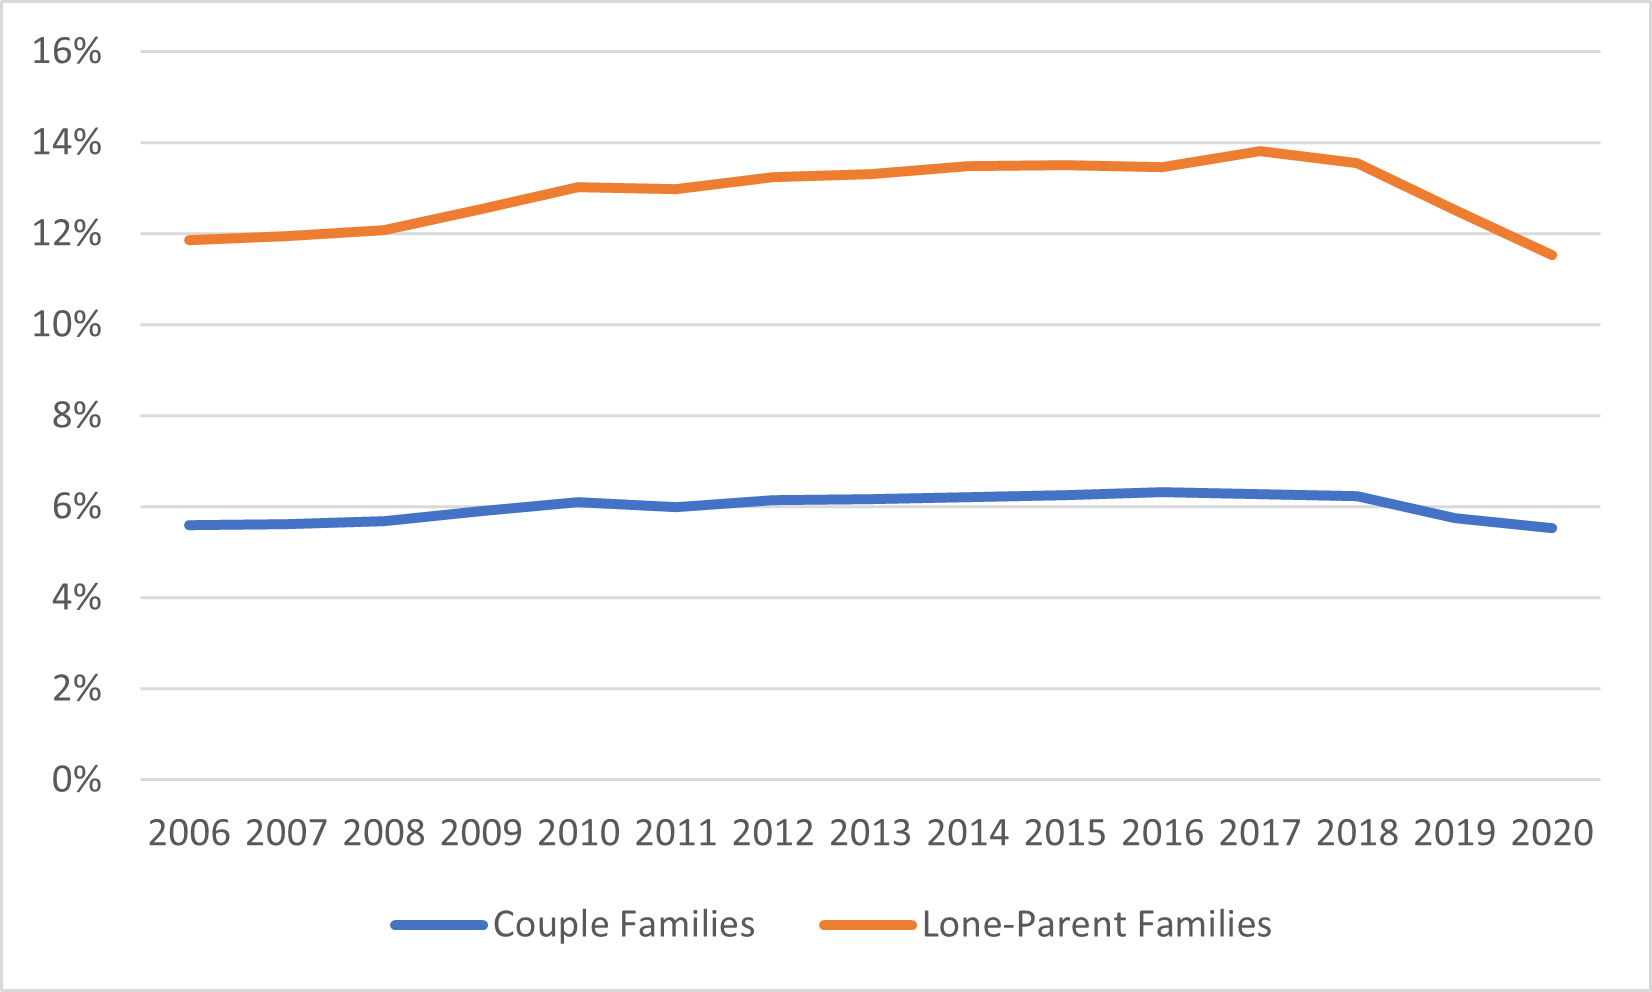
But what if we adjust this chart to look at capacity to pay? In figure 2, I plot the tuition data above against median family income for couple families aged 45-54 (the most common age group to have children entering post-secondary education), as well as for lone-parent families. Why? Because median income is a pretty darn good indicator of family ability to pay. And what we find here is that in the past fifteen years, the ratio of average fees to median family income really hasn’t moved very much at all. That lower line is so smooth you could shoot pool on it. In fact, in 2020, these ratios were lower than at any time in the past decade and a half. There is, to put it mildly, no evidence of declining affordability.
Figure 2: Average Tuition Fees as a Percentage of Median Family Income (where head of household is aged 45-54), by Family Type, Canada, 2006-2020
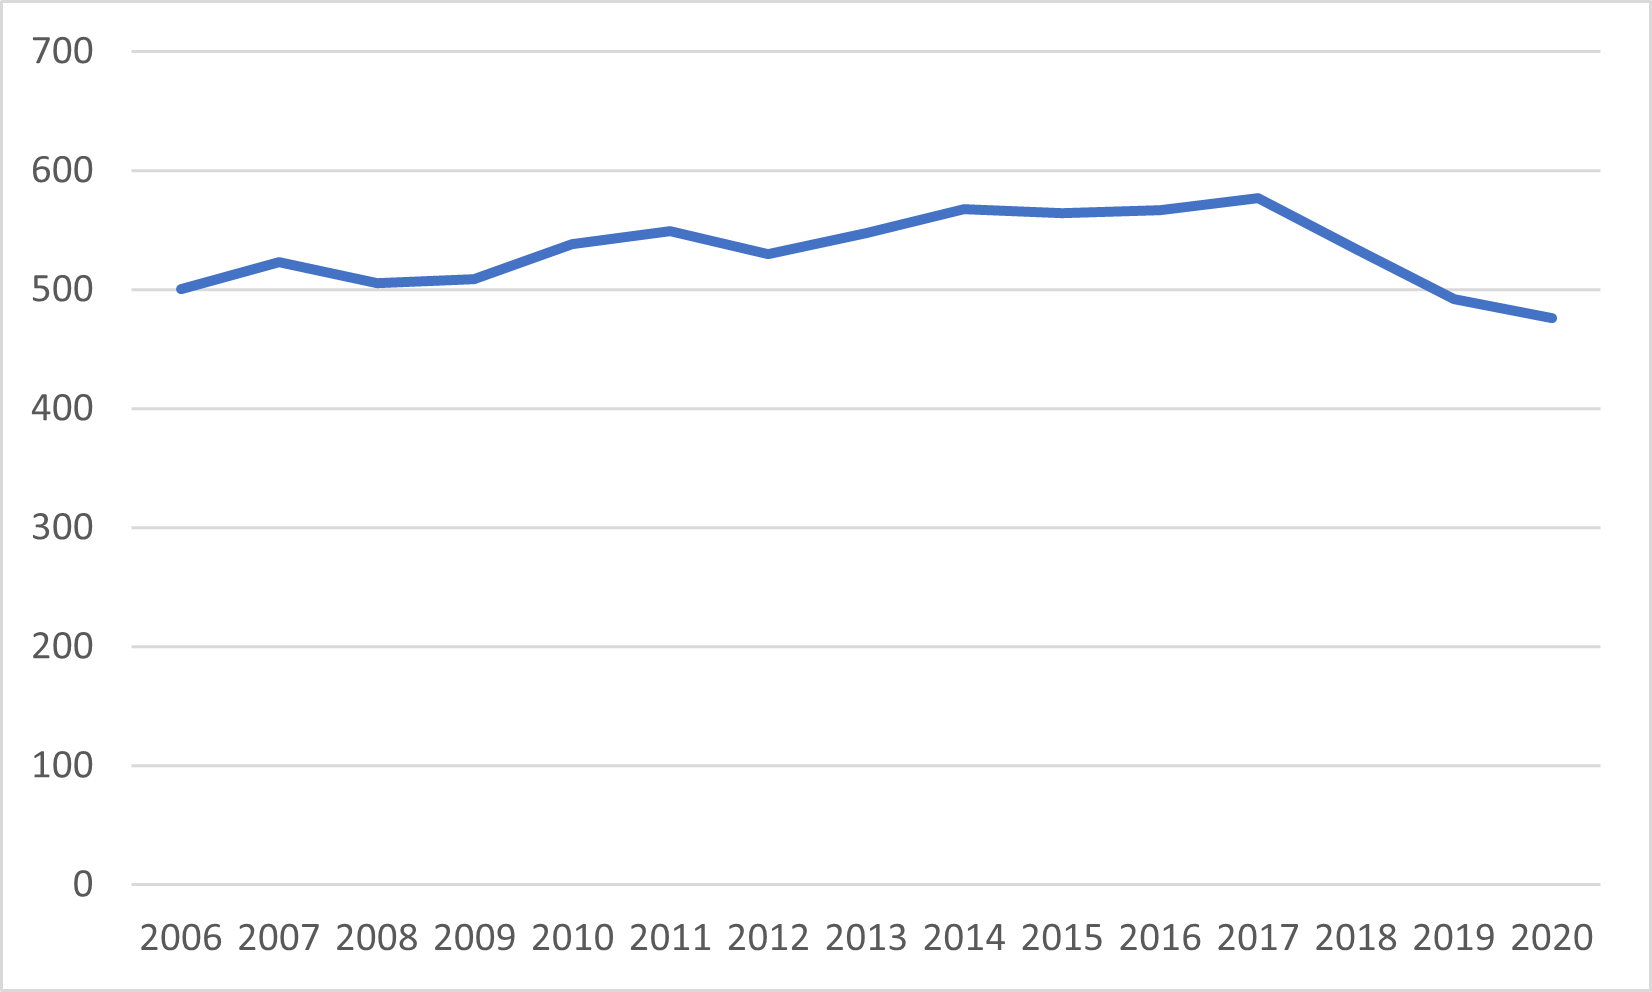
However, figure 2 only makes sense if we are talking about students who can rely on parents for support. What about those who are making it on their own? To account for this, let’s plot average annual tuition fees as a function of the median wage for individuals aged 15-24. And here what we find is that yes, for much of the past fifteen years, this figure was drifting higher, from about 500 hours in 2006 to about 575 in 2017, but plunged thereafter back to 475 hours, mainly (I think) because of developing labour shortages pushing up wages, though rises in minimum wages probably had something to do with it as well.
Figure 3: Hours Required to pay Average Tuition Fees at Median Wage for 15-24 year-olds, Canada, 2006-2020
As you can see, once purchasing power is considered, it’s pretty clear that there has been no change in affordability over the last fifteen years, regardless of what measure of purchasing power is used.
(Why the 2006 start date, you ask? Because unaccountably, this is where StatsCan chooses to cut off its free data service. It has been collecting tuition fees since about 1971, but this is all that is available on its website. I have earlier data in my back files somewhere, and if y’all are interested maybe I will haul it out next week and do this exercise over a longer period. Let me know).
Now this is the point in the discourse where someone always points out “but it’s different in (insert province)” because this is Canada and of course they do. But I have you covered here. Figures 4 and 5 take the data from figure 2 (average fees as a percentage of median family income) for 2006 and 2020 and plot it by province for couple families and lone-parent families alike. Basically, they all show the same things: affordability has improved quite a bit in the Atlantic provinces over the past few years, but not very much if at all in the rest of the country. At the same time, as far as affordability goes, it’s probably best not to be from Atlantic Canada. Quebec, as one might imagine, looks pretty good.
Figure 4: Average Tuition Fees as a Percentage of Median Family Income (where head of household is aged 45-54), Couple Families Only, Canada and Provinces, 2006 vs. 2020
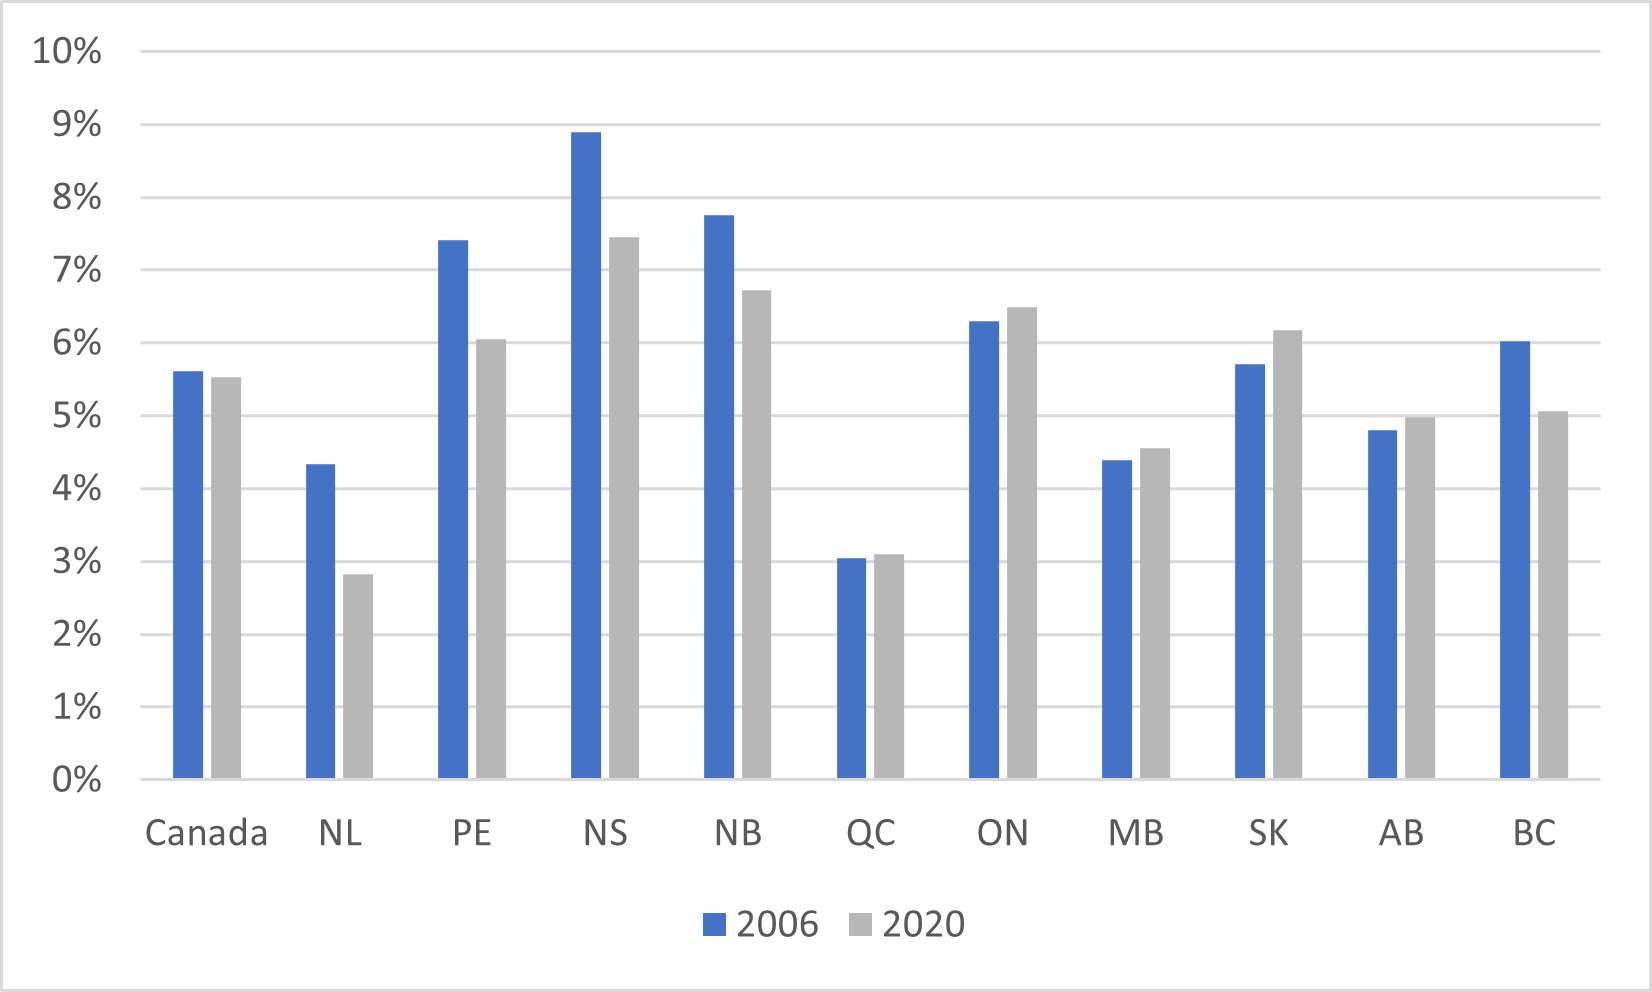
Figure 5: Average Tuition Fees as a Percentage of Median Family Income (where head of household is aged 45-54), Lone-Parent Families Only, Canada and Provinces, 2006 vs. 2020
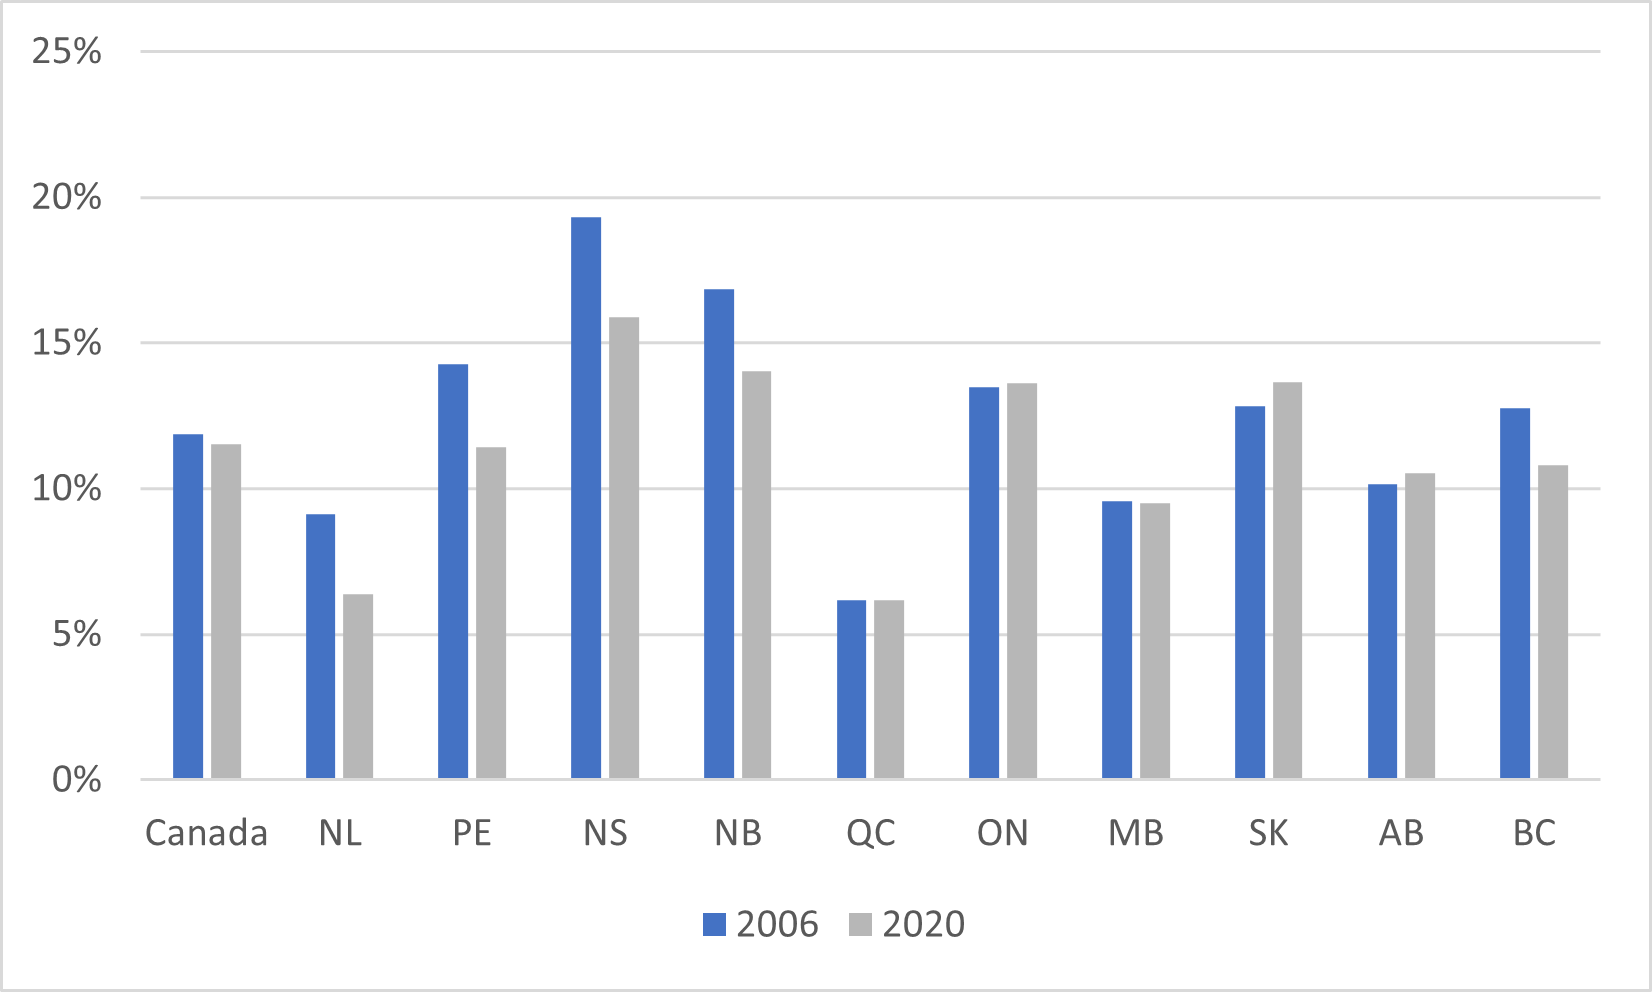
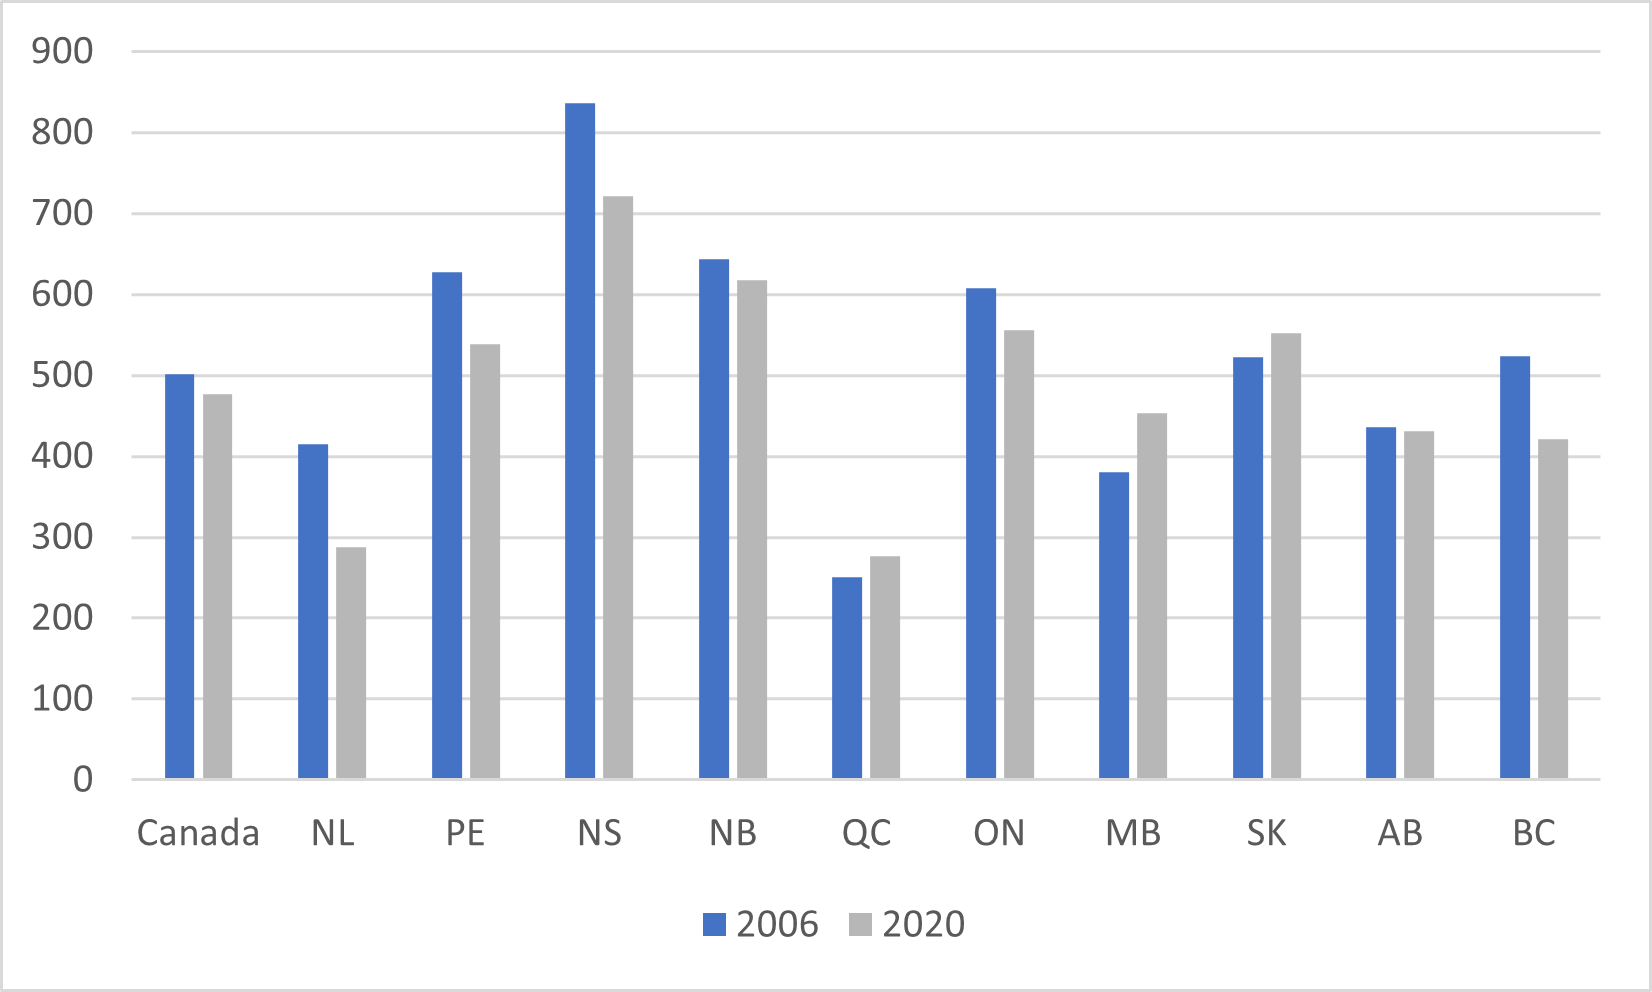
And we can equally do this for student hours worked and it’s mostly the same result: try not to be from Nova Scotia since, thanks both to high fees and low wages, you’ll have to work a couple of hundred extra hours to make it to the same level.
Figure 6: Hours Required to pay Average Tuition Fees at Median Wage for 15-24 year-olds, Canada and provinces, 2006 vs. 2020
Now, let me remind everyone: all this data showing that affordability is relatively unchanged is only using tuition fees as a measure of cost. What I have not done yet is throw in any measure of how student assistance reduces these costs and how massive the increase in non-repayable aid has been in the last couple of years. Come back tomorrow for that.


4 Responses
The problem with focusing solely on tuition costs when discussing affordability of a university education is that it is only one part of the equation. What should really be shown is the total cost of attendance including ancillary fees, books, and most importantly, cost of living. Many students who could manage to swing tuition costs, struggle to pay for the rest.
But Alex, when students talk about affordability now, they mean the whole kit and kaboodle — housing, food, transportation, etc. This is suddenly a lot for universities to be responsible for. What never gets factored in, interestingly, is that many students now take more than 4 years, which adds substantially to the sunk costs, as well as the lost wages.
It would also be interesting to add the whole picture including all the tax credits received by students, and some commentary on how different jurisdictions structure their “all in” costs/affordability/government tax credits
When looking holistically, the biggest cost of attending post-secondary in Canada is housing (and related expenses) for anyone not living at home. One solution is to massively invest in affordable student housing (such as residence buildings), with the understanding that we’re building places to live, not profit centres. This would also take the pressure off local housing markets for all of those people who have nothing to do with the post-secondary sector, as students would no longer drive up demand for affordable housing. And it would make it easier to attract international students, as we’re heading towards a cliff of unaffordability on that front. Oh, and the new residence buildings could be built to modern efficiency standards, accelerating our efforts to decarbonize the economy. There’s a lot to like.