Those of you with minds like steel traps may remember that two years ago Universities Canada issued a set of Principles on Equity, Diversity and Inclusion. Not only did they release a set of principles, but also an Action Plan which among other things promised a shiny new survey and “making quantitative data available for benchmarking and comparative analysis”. Cool, huh?
Only if you looked at the fine print (as I noted at the time), the only thing that was going to be surveyed was information on senior administrators. The term “benchmarking” was only accurate if you torqued the word beyond all recognition so that it meant “publishing no data whatsoever beyond a sector-wide average”. Because the first law of Canadian Education Sector Cowardice is “thou shalt not publish data about organizations if there is the slightest chance that anyone might be embarrassed by coming last in a category”.
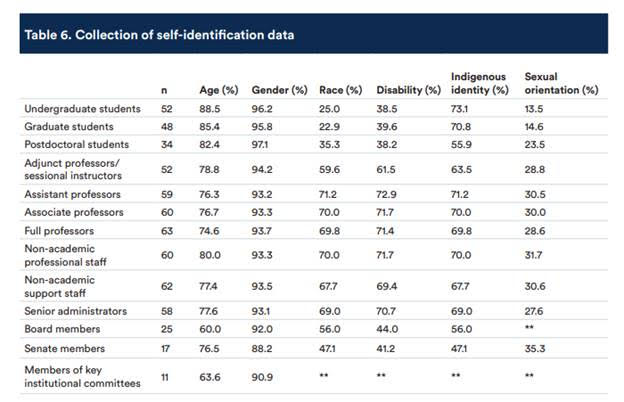
Universities Canada is by no means the only organization that conforms to this rule (and in fairness, as a membership organization, it must be aware of members’ incredibly delicate sensibilities), but boy howdy did they perfect it. We know this because Universities Canada finally published the survey a couple of weeks ago. And as promised, there is only national-level aggregated data and the detailed individual-level data reported on is just about Senior Administrators. Though some of this data is picayune (do we really need to compare rates of disability among Deans of Arts v. Deans of STEM faculties?), some of it is also interesting. For instance, women make up a higher proportion of senior university leadership (48.5%) than they do of faculty as a whole (40.2%). And to its credit, Universities Canada did get very creative with census data to come up with some estimates on what percentage of full time faculty were racialized (21%), have a disability (21.8%) or identifies as Indigenous (1.3%). The first two are very close to the populations of the country as a whole, the latter, as you might imagine, is not. Among the less edifying parts of the report are the surveys of institutional strategies, structures etc. (e.g. percentage of campuses with standard campus-wide definitions of Equity, Diversity and Inclusion), and I have a massive bone to pick with their apparently evidence-free criteria for including institutional “promising practices” (hint: if you are an organization dedicated to advancing institutions in society most concerned with science, truth and accuracy, it is not a good look if your policy for labelling something as “promising” is “one of our members told us so”.) But there was one table I absolutely loved and found really important. It’s this one:

I was kind of floored by this. 70% of institutions keep race, disability and Indigenous identity data on staff? That’s pretty amazing. In fact, it points to how much data is actually out there and how much better this exercise could be next time out (Universities Canada is promising another report in 2022).
What it tells us is that if Canadian universities wanted to, they could publish much better data concerning equity, diversity and inclusion than they have to date. They have the data: they just have yet to show much interest in publishing it. But it doesn’t have to be that way. The other 30% of institutions could join in collecting this data. All institutions could commit to publishing it, individually if they can but certainly collectively come 2022. They could also commit to doing more to collecting such data on students, especially graduate students and post-docs.
It can be done. Institutions just need to overcome the whole cowardice thing.

 Tweet this post
