


Ok, everyone, buckle up. For I have been looking at university financial statements for 2023-24 and the previous few years, and I have Some Thoughts.
In this exercise, I examined the financial statements from 2017-18 onwards for the 66 Canadian universities which are not federated with a larger institution and had income over $20 million. L’Université du Québec was excluded from the analysis below because it has yet to release financial statements for 2023-24.
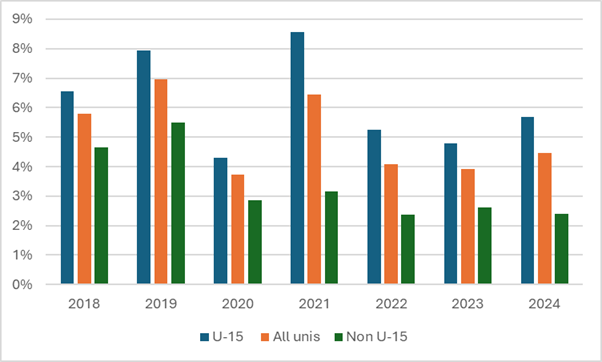
Figure 1 shows the average net surplus (that is, total income minus total expenditures as a percentage of total income) across all institutions for the fiscal years 2017-18 to 2023-24. As is evident from the graph, fiscal years 2018 through 2021 were all pretty good, apart from 2020 (the stock market did its COVID tank right at the end of the fiscal year and radically reduced investment returns that year), and overall surpluses were in the 6% range, which is not bad. But post-COVID, things got a bit rough, and the returns dropped to about 4%. Note, though, that there is a significant gap between the “big beasts” of the Canadian university scene and everyone else. In the good years, U15 institutions, which in financial terms represent about 60% of the system, saw surpluses about two percentage points higher than non-U15 institutions. Since 2022, the gap has been about three percentage points.
Figure 1: Average Surpluses as a Percentage of Total Income, Canadian Universities, Fiscal Years 2018 to 2024
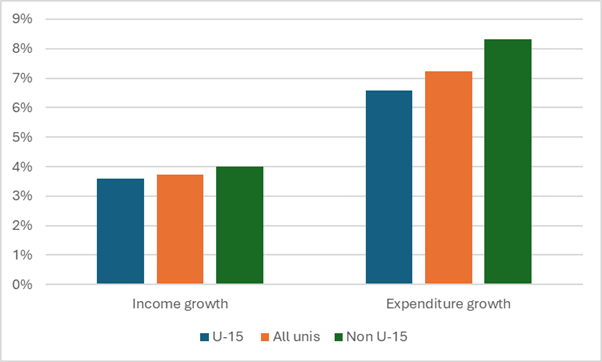
Why have surpluses shrunk in the past few years? No surprise here: it is simply that costs have increased by about 7% in real terms for the past five years (that is about 1.4% above inflation each year), while revenues have only grown 3.7% (0.75% above inflation each year). Income growth has been pretty similar across U15 and non-U15 institutions, but expenditure growth has been significantly larger at non-U15 institutions.
Figure 2: 5-year real change in Income and Expenditure, Canadian Universities, 2018-19 to 2023-24
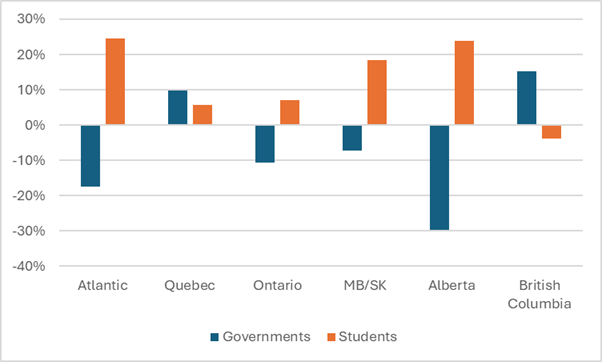
It is worth pointing out here, though, that all of this data is from before any of the effects of the international student visa cap of 2024 come into play. In eight out of ten provinces, it has been income from students that has driven universities’ revenue growth over the past five years. Only in Quebec and British Columbia has government spending been the main driver (and yes, I know, the idea that revenue from students is declining in British Columbia was a bit shocking to me too, but I triple-checked and its true—this is the one part of the country where international student revenue was falling even before Marc Miller started swinging his axe around).
Figure 3: 5-year real change in Income by Source and Region, Canadian Universities, 2018-19 to 2023-24
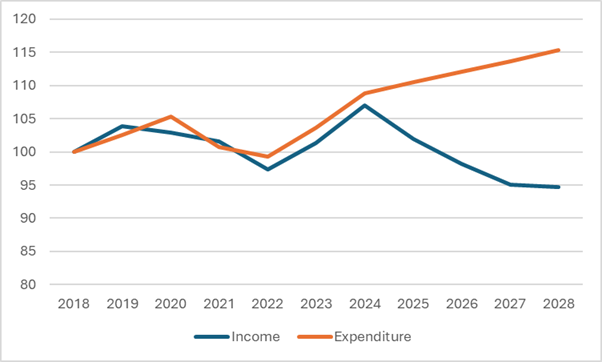
If you assume that international student numbers overall drop by 40% over three years (which is roughly what the government says it wants to achieve), then what we are likely is a decrease of about 11% in total university revenues between now and 2027 (assuming no other changes in enrolment or tuition fees, and an annual increase in government expenditures of inflation plus 1% which is what we saw in last year’s budget cycle but I wouldn’t necessarily bet on it for the future). Meanwhile, if we keep expenditures increasing at inflation plus 1.5%, we will see an increase in expenditures of about 6% by 2028. The result is what I would call a trulyyawning financial gap over the next four years. And it is precisely this that keeps senior admins up at night.
Figure 4: Projected changes in Income and Expenditure, Canadian Universities, 2017-18 to 2027-28, Indexed to 2017-18
Now to be clear, I don’t expect the sector to be posting multi-billion dollar gaps implied by Figure 4 (for clarity: while Figure 4 displays changes in projected income and expenditure in index terms, if the gap that opens up between 2024 and 2028 is as depicted here, the change in net position for universities will be equal to about $7 billion in 2028, which given current surpluses of $2 billion/year implies aggregate deficits of about $5 billion/year or about 11% of total income). The income drop will probably not be quite this bad, both because I expect institutions to raise fees on international students, and because I suspect international student numbers will not fall quite this far because provinces will re-distribute spots going unused by colleges (due to the reduction in enrolments that will ensure from last fall’s changes to the post-graduate work visa program). Similarly, the increase in expenditures won’t be this high either because institutions are going to do all they can to “bend the curve” in anticipation of a fall in revenues. But bottom line: there’s a looming $5 billion income gap that has to be closed just to stay in balance, and larger if we want the system to have at least some surpluses for rainy (rainier?) days in future.
Anyways, back to the present. We can, of course, drill down to the institutional level, too. At this point in the exercise, I have chosen to exclude two more institutions from my calculations. The first is Concordia because it has a unique (and IMHO really irritating) practice of splitting its financial reporting between the institution and its “Foundation” (don’t ask), with the result that the institution’s financial statements alone tend to show the institution as worse off than it really is. The second is Royal Roads, which uniquely took a stonking great write-down on capital investments in 2024 and so frankly looks a lot worse than I think it should.
So with our sample now down to just 63 institutions, Table 1 shows that in fact most universities have been doing OK over the past few years. Of the institutions included in this part of the analysis, 39 have been deficit-free since 2021-22, and 28 have not shown a deficit in any of the last five years. However, there are three institutions where it might be time to start worrying: Carleton, which has posted three consecutive deficits, and St. Thomas and Vancouver Island University, which have posted deficits in each of the past five years. Carleton is a little bit less worrisome than the other two because it socked away some huge surpluses in the years prior to 2022 and so has a little bit more runway. I’ll come back to the other two in a moment.
| Years in deficit | Since 2019-20 | Since 2021-22 |
| 5 | 2 | – |
| 4 | 0 | n/a |
| 3 | 6 | 3 |
| 2 | 13 | 7 |
| 1 | 16 | 16 |
| 0 | 28 | 39 |
Figure 5, below, shows combined net surplus over the past five fiscal years (2019-20 to 2023-24) as a percentage of total revenues. There are eight institutions which have net losses over the past five years, and another eight with surpluses between 0 and 2% of total revenues, which I would characterize as “precarious.” There are another 29 institutions with combined five-year surpluses, which are between 2 and 5% of total revenues, which are not great but not in the immediate danger zone either. Finally, there are 18 institutions with surpluses of 5% or more, which I would characterize as being “safe,” including two (Algoma and Cape Breton) which have five-year surplus rates of over 20% (this is what happens when your student body is 75%+ international)
Figure 5: Distribution of 5-year aggregate net surpluses, Canadian Institutions, 2019-20 to 2020-24
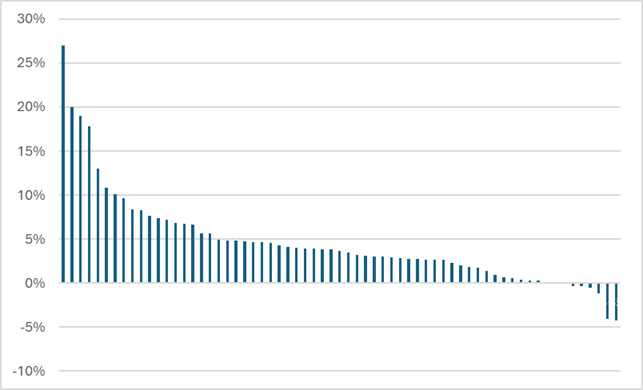
But note the right-hand side of that graph. There are two institutions that have five-year deficits equal to more than 4% of their total revenues. And those two are the same two that have posted deficits for each of the past five years: St. Thomas University in New Brunswick and Vancouver Island University in British Columbia. I’ll talk about them in a bit more depth tomorrow.


One Response