One of the unbelievably cool things about this week’s PIAAC release is the degree to which StatsCan and CMEC have gone the extra mile to not only oversample for every province, but also for every territory (a first, to my knowledge), and for Aboriginal populations, as well – although they were not able to include on-reserve populations in their sample. This allows us to take some truly interesting looks at several vulnerable sub-segments of the population.
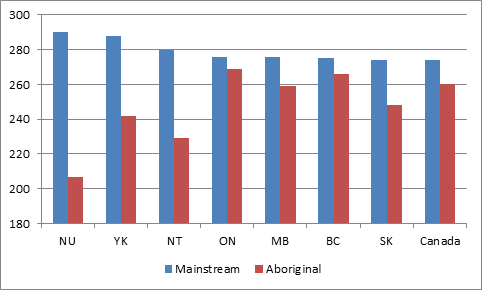
Let’s start with the Aboriginal population. Where numbers permit, we have province-by-province stats on this, albeit only for off-reserve populations. Check out figure 1:
Figure 1: PIAAC Literacy Scores for Aboriginal and Mainstream Canadians, Selected Provinces.
So, good news first: in BC and Ontario, the gap between Aboriginal and mainstream Canadians is down to single digits – this is great news, even if it doesn’t include the on-reserve population. But given the differences in educational attainment, you have to think that a lot of this is down to attainment rates: if one were to control for education, my guess is the difference would be exceptional.
The bad news, of course, is: WHAT THE HELL, NUNAVUT? Jumpin’ Jehosophat, those numbers for the Inuit are awful. The reason, of course, again comes down to education, with high-school completion rates for the population as a whole being below 50%. Other territories are better, but not by much. It’s a reminder of how much work is still needed in Canada’s north.
The immigration numbers are a bit more complicated. The gap in literacy scores between non-immigrants and immigrants is about 25 points, and this gap is consistent at all levels of education. That’s not because immigrants are less capable, it’s because, for the most part, they’re taking the test in their second – or possibly third – language (breaking down the data by test-takers’ native language confirms this). As someone pointed out to me on twitter, the consequence of this is that PIAAC literacy isn’t pure literacy, per se – it’s a test of how well one functions in society’s dominant language. Conversely, though, since facility in the dominant language clearly has an effect on remuneration, one wonders how much of the oft-discussed gap in salaries between immigrants and native-born Canadians, which seems illogical when just looking at educational levels, might be understood in light of this gap in “literacy”?
A larger point to remember, though, is that the presence of immigrants makes it difficult to use overall PIAAC scores as a commentary on educational systems. Over 20% of Canadians aged 16-65 are immigrants, and most of these people did their schooling outside of Canada, and, bluntly, they bring down the scores. Provinces with high proportions of immigrants will naturally see lower scores. Policymakers should be careful not to let such confounding variables affect their interpretation of the results.


 Tweet this post

Possibly another good reason (or two) for PEI’s exceptional performance in yesterday’s post. Do they provide numbers, or can you adjust for the non-immigrant, non-aboriginal population?
Do Inuit in Nunavut live on reserves? If not, it seems their scores are lower just because all Inuit could be sampled, whereas only Aboriginal people living off reserve (and presumably exposed to better-quality education) were sampled.
Also, your point about immigrants taking the test in their second or third language probably applies to many Indigenous people in Canada.
None of this is meant to suggest that there aren’t huge literacy gaps between Indigenous and non-Indigenous Canadians. The situation is sadly much worse than these data indicate because of the state of education on reserves.
Hi Rachelle. No, there are no reserves in Nunavut because there were never any treaties with the Inuit. And that’s a very good point re: comparisons with other aboriginals although my guess would be there would still be a gap even if you took that into account – only about 40% of First Nations live on reserve…if you count Metis to get a figure for “aboriginal Canadians” as well it’s considerably lower.