Last week, I showed you some of the coolest data from the new edition of the OECD’s Education at a Glance. However, I didn’t do anything on finances because I was not sure about the Canadian numbers (I’m still deeply puzzled by the numbers in a couple of other countries), but thanks to some very helpful folks at StatsCan, I now understand what is going on and it’s just probably quite bad news for Canada.
Let’s start with looking at total expenditures per tertiary students in USD at Purchasing Power Parity, which is what is shown below in Figure 1 (in Canada this is a mix of values at the college and university levels). There is a lot going on in this graph, which shows figures for both 2016 and 2021 for ten selected OECD countries (2016 figures are expressed in constant 2021, using changes in US CPI, which I know is not exact but sue me). Any changes between 2016 and 2022 might be because of a number of things: a change in funding, a change in student numbers, or a change in PPP rates. In most countries, expenditures are rising, even after inflation. I have no idea what is going on in the UK, where there has been no new money in the system and nor has there been any change in PPP values and yet expenditures are apparently booming. The Canadian data—which shows our per student expenditures to be falling—looks about right to me though.
Figure 1: Total Institutional Expenditures Per Student in USD at PPP, Tertiary Education, Selected OECD Countries, 2016 and 2021
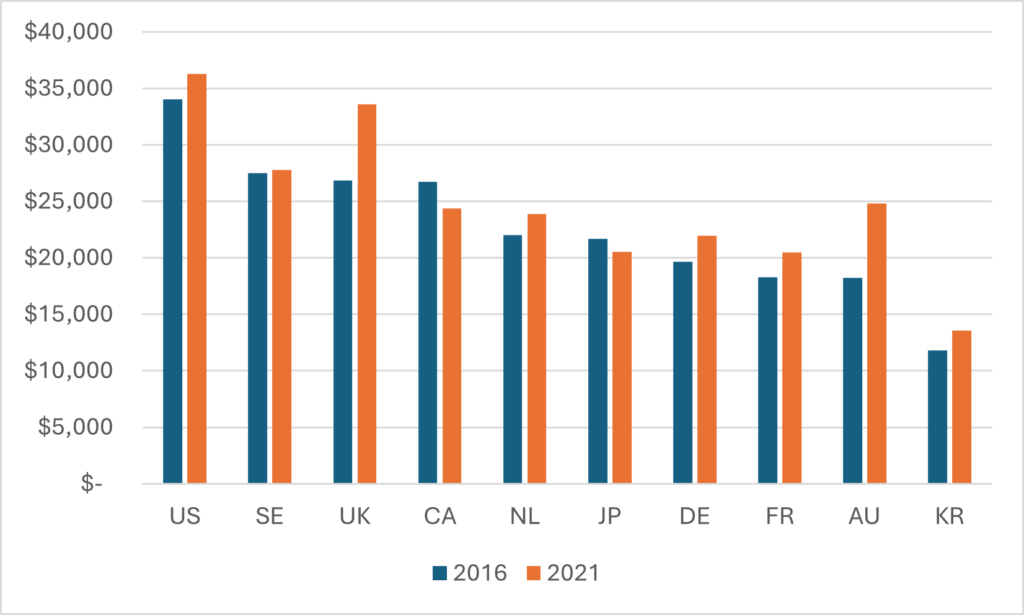
A note here: Figure 1 shows an average across all tertiary institutions. In the cases of Canada, US, Japan, and Korea, this includes significant numbers of colleges which tend to have lower per-student spending than in full degree-granting institutions, which is where the bulk of the European money is spent. If we did a straight universities-to-universities (which we probably could do with a little interpolation and guess work) Canada would look much better in comparison with the others.
On to Figure 2, which I think is kind of cool. The OECD asks countries to break down their institutional expenditures into three categories: “core expenditures,” “ancillary services,” and “R & D.” Not all countries can provide this data (Canada being one of them) but I am pretty sure I can get pretty close to a number using publicly-available FIUC and FINCOL data. I won’t bore you all too much here with details, but basically I took R & D expenditure at universities and colleges to mean sponsored research plus the value of faculty time devoted to research (available here), and ancillary services to mean whatever StatsCan classifies as ancillary services (which may or may not match the OECD definition, I did not get that far into the weeds). I derived those numbers for 2021-22, worked out the share total expenditure devoted to each of these two categories (23.8% on R & D, 3.7% on Ancillary fees), and then applied this to the per-student expenditure figure from Figure 1. And voila!
Figure 2: Institutional Expenditures Per Student by Type, Tertiary Education, in USD at PPP, selected OECD Countries, 2021
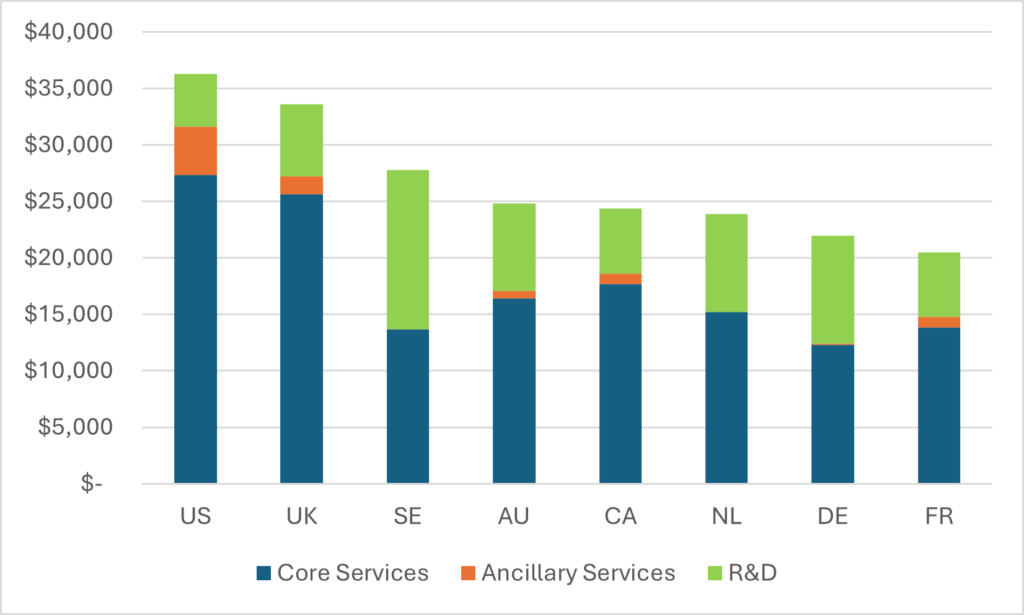
A couple of things about this graph: first, it’s clear that at least part of the American “lead” in expenditures comes not from expenditures on core educational services but on ancillary services such as student housing or athletics, which other countries clearly don’t care so much about (Sweden and the Netherlands don’t even list any ancillary expenditures, which is probably not literally true, but tells you something about how important they think it is to track such things). The second is that different countries spend vastly different amounts per student on R&D in universities. Some of this probably has to do with different ways of calculating this figure (the US figure is absurdly low, for instance; my guess is it is low-balling professorial time significantly if not ignoring it completely). In any event, by this calculation, Canadian tertiary institutions are third among comparator OECD countries in terms of the amount they spend on core services.
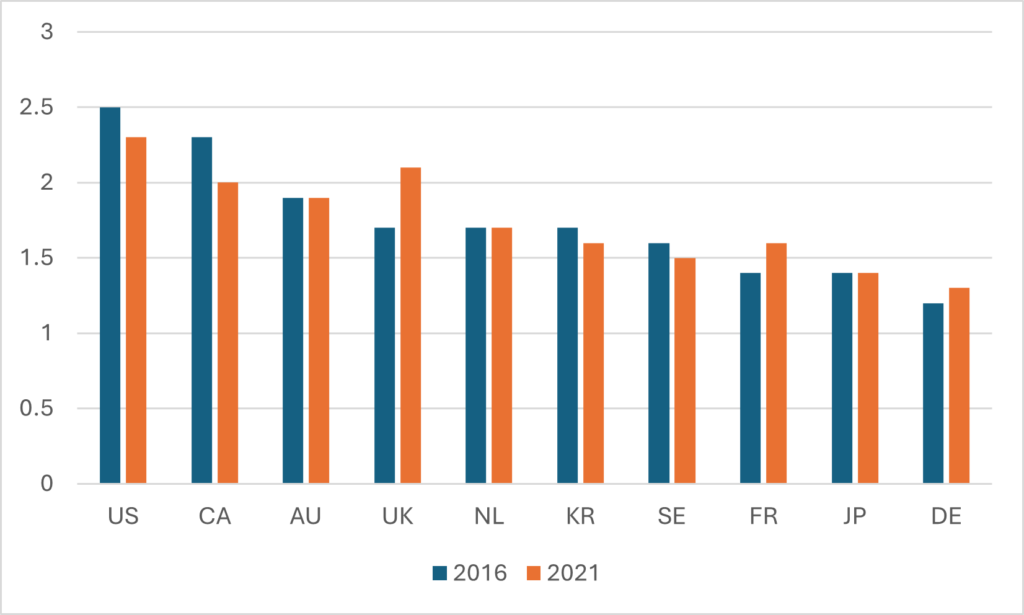
Figures 3 and 4 switch the lens from raw dollars per student to expenditures as a percentage of gross domestic product. The former shows GDP expenditures per country and source, public and private. Higher Education institutions in the anglosphere countries, which all take in large amounts of private money, tend to have higher overall income than institutions in Europe, where they do not. This is a historic pattern, not much new here. The latter shows change over time, and (this is kind of important) that in most countries the percentage of GDP devoted to tertiary education is rising while in Canada it is falling. It’s not alone in falling—numbers in the US are dropping too, and Korea is also experiencing a small drop as well (unsurprising given demographically-driven shrinking demographics). But it is dropping farther and faster in Canada than it is elsewhere. This is a bad sign.
Figure 3: Public and Private Expenditure on Tertiary Institutions as a Percentage of Gross Domestic Product, Selected OECD Countries, 2021
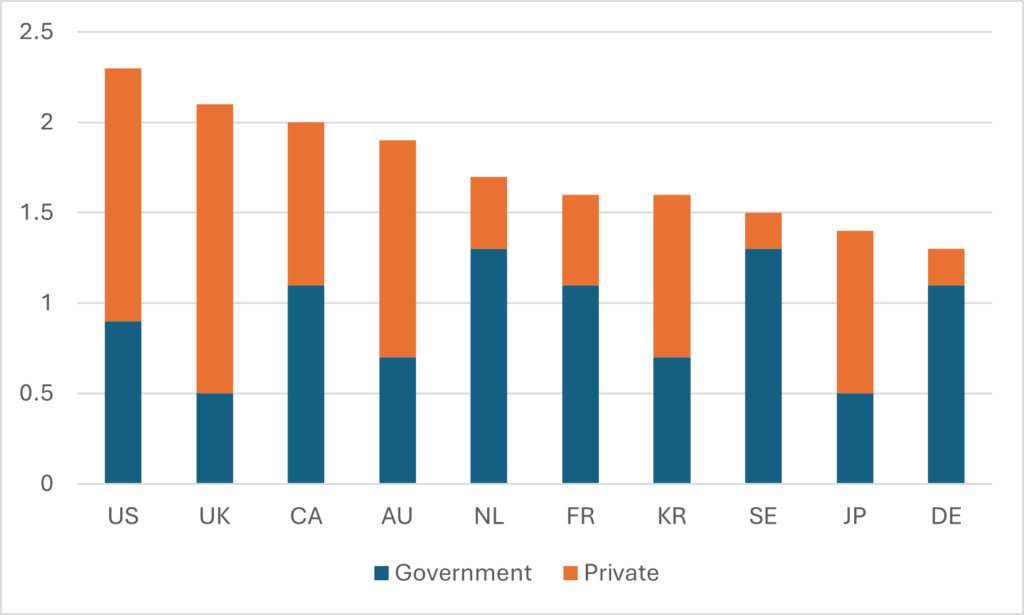
Figure 4: Expenditures on Tertiary Institutions as a Percentage of Gross Domestic Product, Selected OECD Countries, 2016 and 2021
Now on to a metric which I don’t think I’ve ever used in the past but which I suddenly find fascinating: tertiary education as a percentage of total government spending. By this measure, Canada is on the low end of the spectrum, at about 2.4%, as shown in Figure 5. But take a look at Figure 6, which shows annual change in expenditures as a percentage of total government funding. In most countries it is down modestly, meaning that total government spending is increasing by slightly more than total public expenditures on tertiary education. But in Canada over the period 2016-2021, the ratio is falling by 7.5 percent per year. That’s not just declining tertiary education spending, that’s declining spending in the context of a very significant increase in the overall increase int the size of government. To be blunt: according to this data, we’re spending a lot more than we used to but we’re choosing not to invest it in education (almost like we’re eating the future).
Figure 5: Public Expenditures on Tertiary Education as a Percentage of Total Government Expenditures, 2021
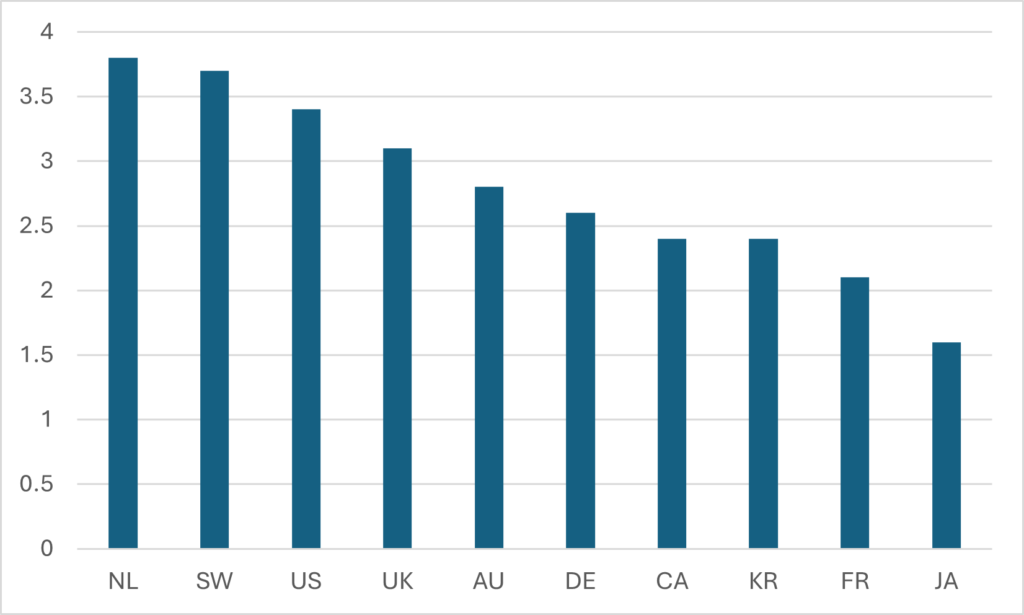
Figure 6: Average Annual Change in Public Expenditures on Tertiary Education as a Percentage of Total Government Expenditures, 2016-2021
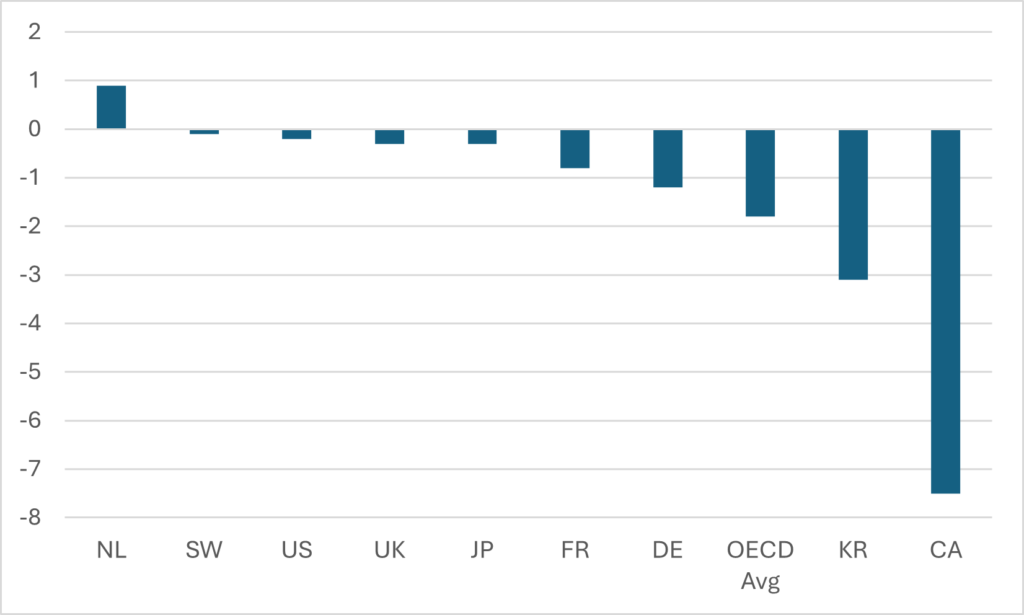
Now, you could look at this data and say, “but c’mon that’s just COVID spending.” And maybe you’d be right. We don’t know how much of this adjustment is happening on the numerator and how much in the denominator. Maybe it’s Canada’s COVID spending that was anomalous, not our pattern of education spending. If this were true, what it would mean specifically that our COVID spending was more expansive and lasted longer into 2021 than it did in other countries.
Seems like a problem worth delving into in the near future. Stay tuned!

 Tweet this post
