


Last Tuesday, the OECD published Education at a Glance, 2024. As usual, there is a whack of interesting comparative data in there—more than usual, actually, as I will show you in a second (and Canadian data is for the most part not missing, which is pretty great). However, I do want to say that the data on Canadian tertiary education finance shows a puzzling and steep decline which I can’t replicate using any data issued in Canada. For the moment, I will skip this stuff in my roundup and will come back to it after consulting with StatsCan on what the issue might be.
Instead, let’s focus today on a few pieces of data which I think are pretty interesting if not always especially consequential.
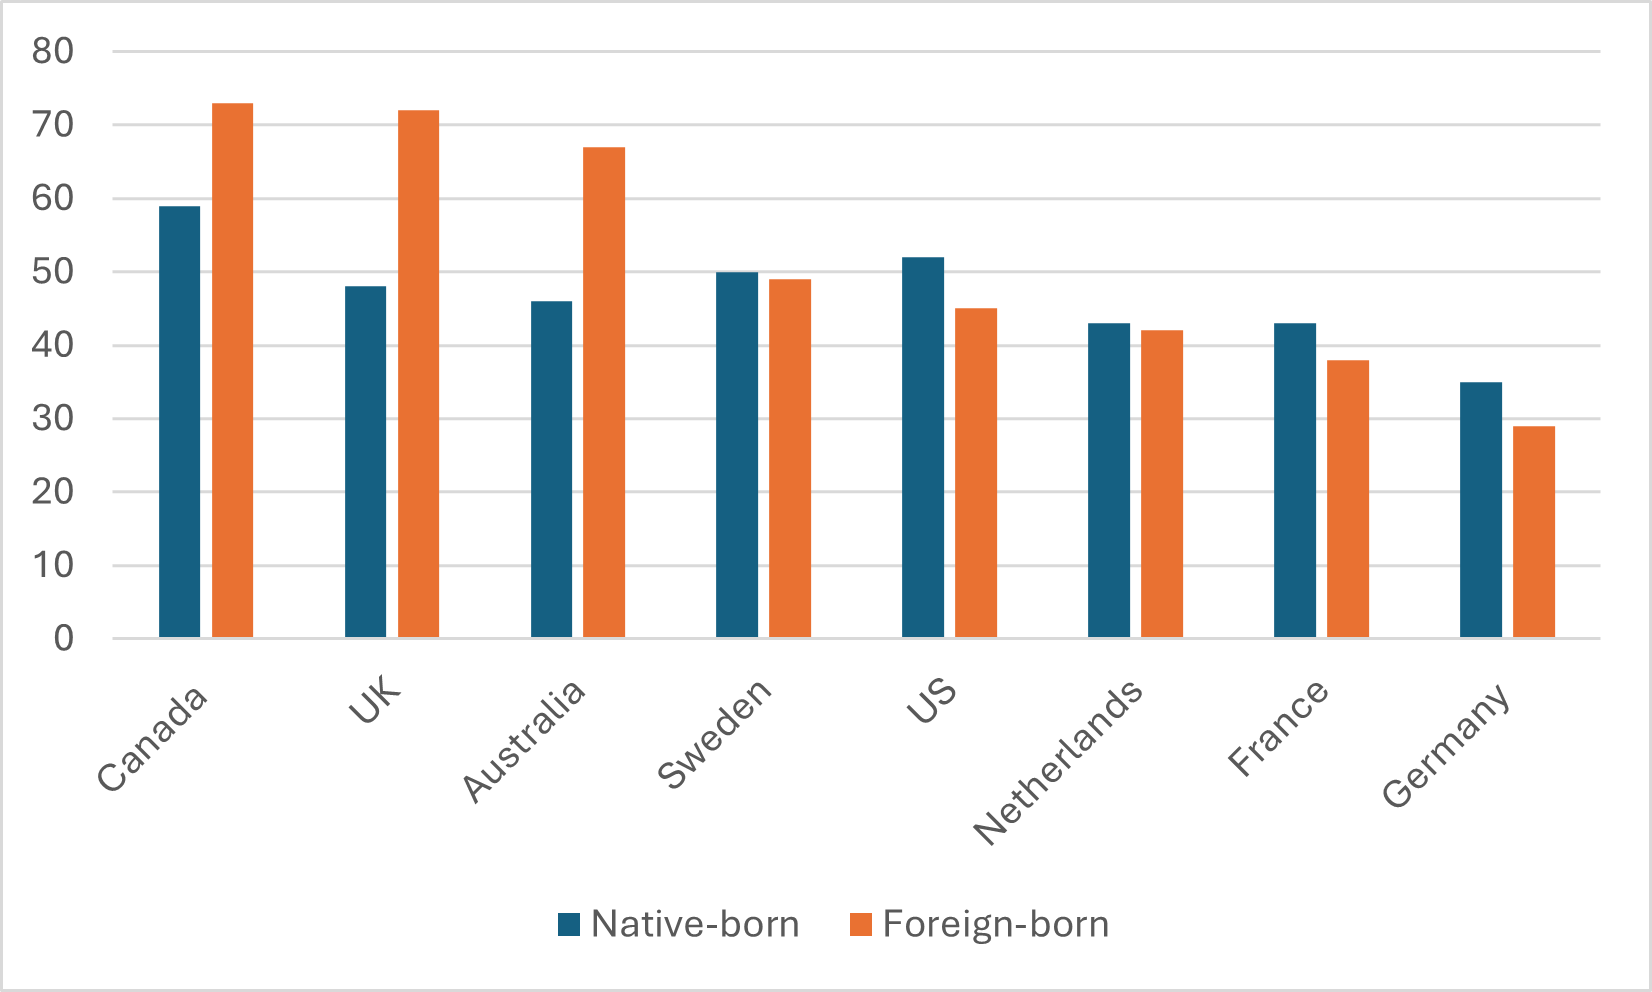
Let’s start by looking at levels of education attainment based on immigration. Due to a mix of history, geography, and immigration policies, the attainment rate of immigrants can look quite different from one place to another. And, similarly, due to a variety of education and social policies, the attainment rates of native-born citizens vary a lot too. I’ve seen these numbers disaggregated for Canada before, and not surprisingly given our points-based immigration system, immigrants tend to have higher education levels, but I’ve never seen this disaggregated across a wide number of countries before. Figure 1 shows the results for some select OECD countries. Turns out Canada is not completely exceptional: the UK and Australia have similar patterns of educational attainment for foreign- and domestic-born, but together those three are quite different from the rest of the OECD.
Figure 1: Tertiary Education Attainment by Country and Place of Birth, 25–64-year-olds, Select OECD Countries
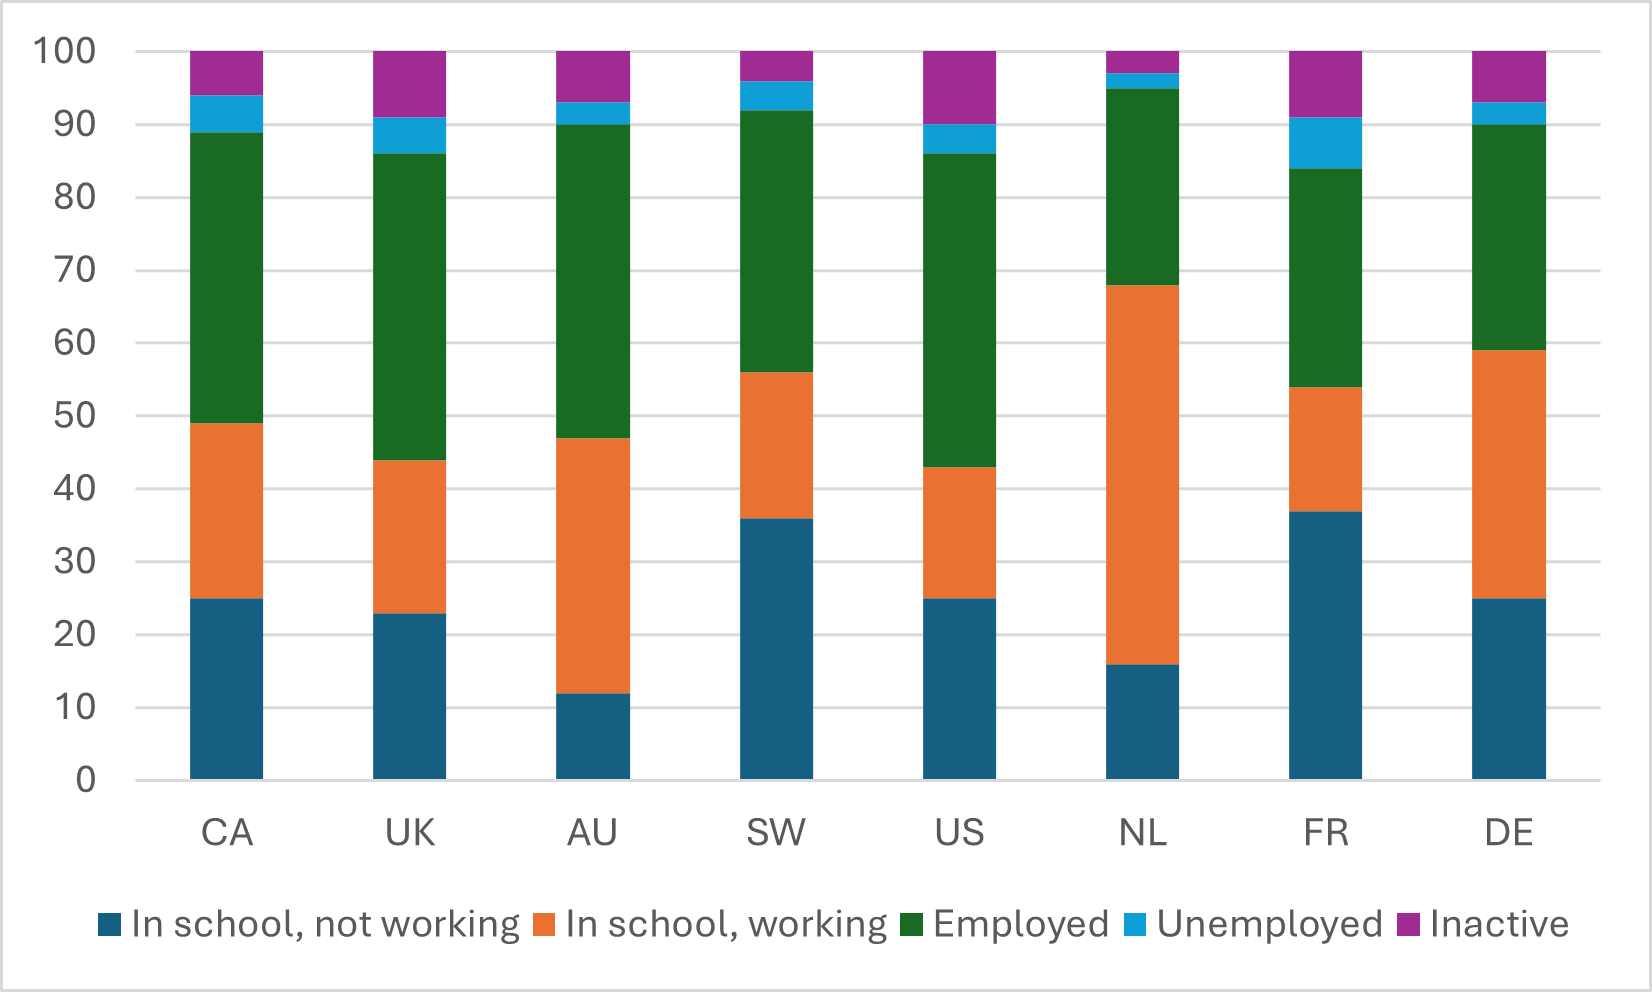
On to the issue of how 18–24-year-olds spend their time. In Figure 2, we look at five possible outcomes for young people: studying without working, combining study and work, working, unemployed, and inactive in the labour market (meaning not even looking for work). In most countries, about 50% of 18–24-year-olds are in some form of education, though the percentage varies somewhat (the US is lowest at 43%, Netherlands the highest at 68%). The percentage who are considered “NEET,” or not in education, employment or training—a combination of the unemployed and the inactive—is also pretty similar across all countries, ranging from 5% in the Netherlands to 14% in the US. But what’s actually pretty amazing is the proportion of students who are also in work. In France, only 17% of young people both work and study (the US at 18% is not much better). But in the Netherlands, it is fully 52% of 18–24-year-olds, which makes it a huge outlier both in Europe and in the OECD as a whole. My takeaway from this is that although people focus on NEET as a policy issue, the actual differences in exactly how young people choose to split or combine their time between earning and learning is much more interesting.
Figure 2: Employment/Education Status of 18–24-year-olds, Select OECD Countries
There’s some interesting data in this year’s report about the percentages of graduates at different levels of education which come from public and private institutions. Not surprisingly, the main finding of this data is that as the level of education rises from sub-bachelors to doctoral credentials, so too does the likelihood of graduating from a public institution. That’s not earth-shattering or anything, but it’s nice to see it confirmed in numbers. Below in Figure 3, I reproduce the numbers just for bachelor’s degrees. Not because I think they are accurate or comparable—they quite clearly aren’t—but because they say something about the way countries choose to classify institutions.
Figure 3: Percentage of Bachelor’s Graduates Coming From Public Institutions, 2021, Select Institutions
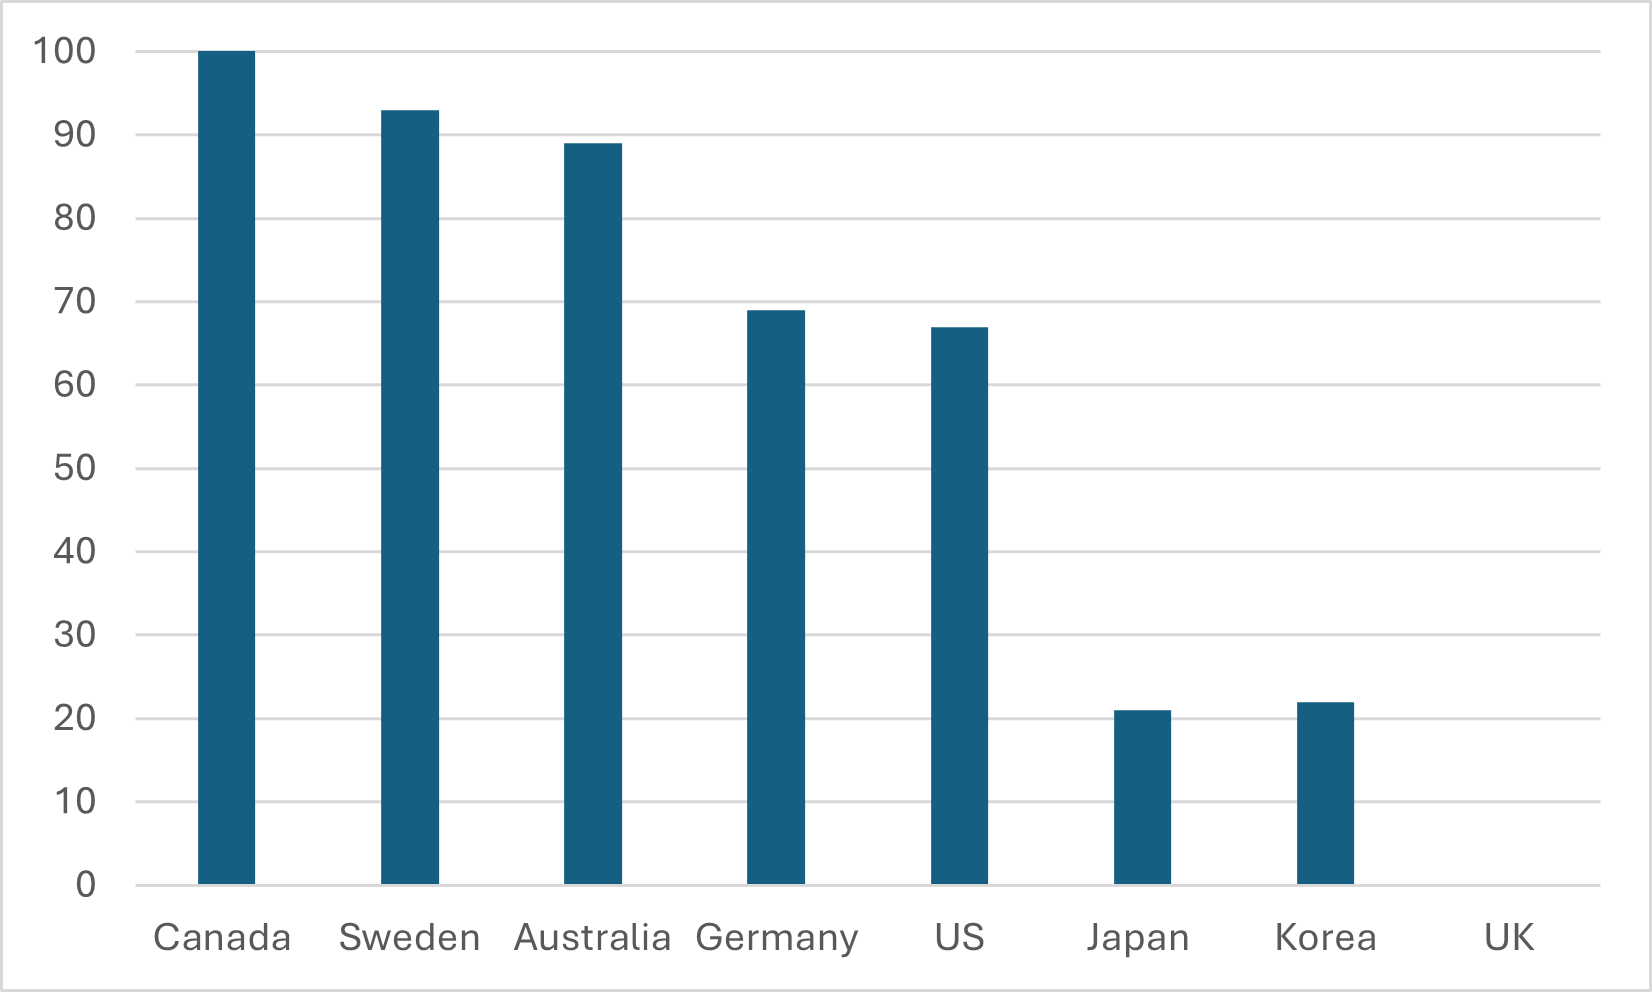
Let’s start with Canada, which reports 100% of graduates at all levels as being in “public” institutions. This is of course nonsense. University Canada West alone must be responsible for 10% of master’s degrees issued in this country, and at the bachelor’s level there are at least a half-dozen members of Universities Canada which cannot in any way, shape or form be described as “public” (Trinity Western being the largest). Perhaps—maybe—a more accurate statement is that 100% of the institutions that submit data on graduates to Statistics Canada are public sector. But that’s quite different. Similarly, the idea that 0% of UK graduates are at public universities is a weird, ideological fiction. The legal status of the nearly all significant universities in the UK—receiving money from government for teaching and research, subject to public sector regulation but technically not part of the public service—is no different from Canada. But since OECD can’t actually tell governments to do one when they report things in a ridiculous way, this is what you get: two countries with largely similar sectors reporting completely different results for no good reason.
(The result from Germany—that nearly a third of all bachelor’s degree holders hail from private institutions, in a country with free tuition and where the public sector until recently had a near monopoly—is really interesting, but given the weirdness in national reporting classes, I am not quite sure how much I believe this. Worth a follow-up at some point, though, maybe on the podcast).
This is all pretty cool, even if it doesn’t all have immediate policy implications. I think I will leave it there for now, but I will do another piece on financial comparisons as soon as I hear back from StatsCan on the data.


One Response
Indeed, it requires a peculiar British intellectual stretch to accept UK universities’ conceit that since they are not part a government department they are part of the independent or private sector.
The Brits apply similar reasoning to schools. Since most have been converted to governance by their own boards as ‘academies’ they are reported to the Oecd and within the country as private schools, tho their funding is substantially public and they are heavily regulated.