


The OECD released its Education at a Glance (you can download yesterday’s release here), and every year at this time I do a report on the release (see previous articles from 2016, 2017, 2018, 2019). Mostly my précises focus on the same couple of things, to wit:
- Canada has among the highest rates of higher education participation in the world, mainly because our college/polytechnic system is bigger and richer than that of any other country.
- Whether you measure expenditures on a per-student basis or on a % of GDP basis, Canadian post-secondary education is well-funded. Not quite the best-funded in the OECD, but pretty close. Top five, anyway.
- This high level of funding exists partly because we ask individuals to contribute substantial sums through tuition, but also because Canadian governments, collectively, fund higher education at a level higher that the OECD average. Governments in Germany – sainted, free-tuition Germany – spend a smaller portion of national wealth on higher education than do their Canadian counterparts.
It would be boring if I did all this again, so just take it as read that all that stuff is true. Instead, let’s look at some interesting new comparative work in this one. I applaud their focus on vocational education, though Canada’s vocational system is so difficult I don’t think many of the axes of comparison work very well for us. So, I’ll move straight over to some of their work on returns to education and university cost structures.
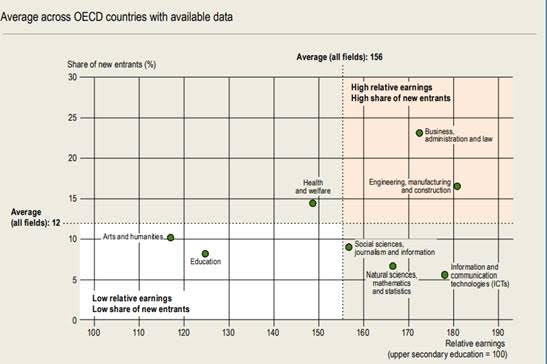
One graph I really liked is reproduced below as Figure 1, showing average earnings premium vs. share of enrolments for each major field of study, across all OECD countries (Canada’s data doesn’t quite look like this, but it’s close enough). One of the main findings here is that across all countries, science graduates actually don’t make out that much better than social science graduates (definitely the case in Canada), and also that by and large the high-earning programs are the ones to which students are attracted, suggesting that students are not completely insensitive to long-run returns.
Figure 1: Relationship Between the Share of Tertiary New Entrants and Relative Earnings, by Field of Study
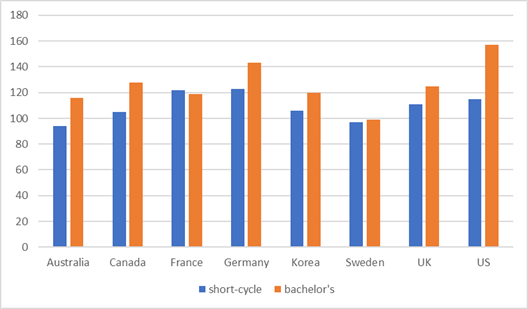
But perhaps more intriguing than these cross-national averages are the difference we see in post-graduate salaries across countries. Figure 2 shows the income of recent graduates (ages 25-34) from both short-cycle and bachelor’s degree programs, as a percentage of the average upper secondary graduates’ salaries in the same age group Anything above 100 represents a salary gain for a graduate of a short-cycle or bachelor’s program. Strikingly, there are a couple of places (Sweden in particular, but it also applies to short-cycle graduates in Australia) where the short-term returns to education are negative – that is, recent higher education graduates’ incomes are below those of similarly-aged individuals with upper secondary education (this, by the way, is a pretty good argument for free tuition in France, although it may suggest that the country has too many higher education graduates). Graduate premiums seem to be highest in Germany and the US; Canada is about middle of the pack on this measure.
Figure 2: Average salary of Tertiary Graduates aged 25-24, as a Percentage of Average Upper Secondary Graduates’ Salaries, by Level of Education Completed
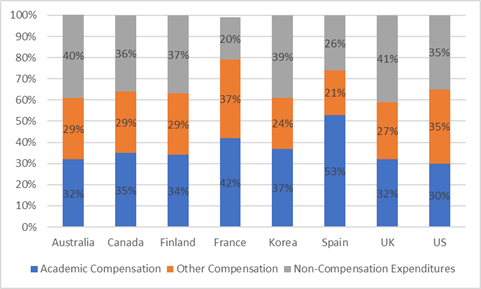
The last piece of interesting data is one I have been trying (unsuccessfully) to document for years, but have not been able to because most countries don’t really break down their institutions’ spending very well. Notably, this is actually one area in which Canadian data is far superior to those in most other countries, thanks to the work of the Canadian Association of University Business Officers. Analysing this gets to the core of the question of where money goes in a university – to academic compensation, other staff compensation, or to other non-salary items. It’s not an easy comparison for much of Europe because in many cases the accounting systems don’t differentiate between different types of salary income. But it is available for a few countries and it turns out that actually mean old neoliberal Canadian universities are actually about middle of the back in terms of the portion of salaries going to academics (cuddly socialist Finland actually devotes somewhat less money to academic compensation than Canada). Not that there is a “correct” distribution: too low an emphasis on non-salary purchases probably means the institution is not very well resourced for things like IT and students services.
Figure 3: Tertiary Institutes’ Expenditures by Type, Selected OECD Countries
Anyways, that enough for another year of OECD. Tomorrow: the long-awaited New Brunswick election primer (you have all been dying for it, admit it).

