


Yesterday was Education at a Glance release day. That’s usually the time when I take a look at the latest data from across the OECD and point out that in fact we in Canada have it pretty good. Or, at least that was the piece I expected to be writing yesterday morning. Until I found out that Canadian data was missing from more than just the usual number of tables. Statscan was more annoying than usual this year, which means I have less to show you than I usually would. But still, I think there is some interesting stuff in here.
To start, let me show you the graph I do every year, which shows total expenditures on tertiary institutions. It shows, as it usually does, that Canada has among the highest expenditures on tertiary education of any country, but that it is only just above average for universities and waaaayyy above average for colleges.
Figure 1: Expenditures on Tertiary Institutions as a Percentage of GDP, Selected OECD countries
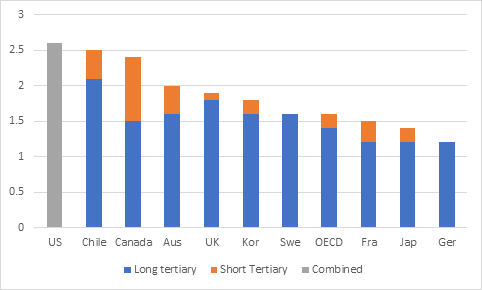
Conclusion: our system might not be as well-financed as we would wish it to be, but there is no meaningful way to look at the international data and claim Canadian PSE is underfunded.
This edition of OECD’s Education at a Glance spends quite a bit of time looking at educational outcomes for disadvantaged groups: specifically, it looks at equity of outcomes for immigrant students (or whose parents are immigrants) and for students whose parents have not obtained a post-secondary credential. Because the National Graduates Survey does ask questions about parental education levels meaning there is at least one area where we can compare Canadian outcomes to international ones. Cool!
In fact, the data is good enough that it allows is to calculate what I call the Educational Equity Index (EEI) (see pages 5 to 7 in my 2004 paper on this here for a sense of methodology). Basically, it’s the ratio of the percentage of adults with a post-secondary credential and who are of an age likely to be parents of university students (usually 45-64) to the percentage of students (or in this case, graduates) whose parents have university credentials. The close the number is to 100, the more the student body “looks like” the population as a whole and hence the more equitable it is; the lower the number, the more “elite” the student body is compared to the population. The data doesn’t allow us to make comparisons across the student body as a whole, but it does allow us to compare the equity level of different countries graduating classes. And here’s what we find:
Figure 2: Educational Equity Index, Select Countries’ Graduating Classes, Based on OECD EAG Table B7.2
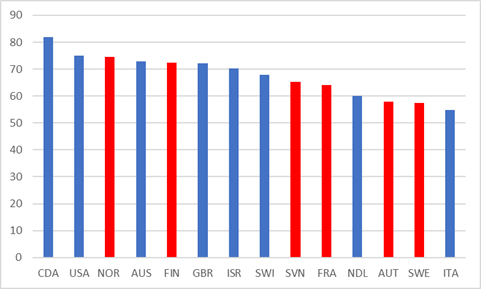
So, Canada has the most equitable graduating class in the OECD and the USA is second. I have indicated the countries with zero tuition fees in red if you want to try to draw some conclusions from that data. My strong suspicion is that this very good result has less to do with tuition than it does with overall high levels of funding.
But that’s a discussion for another time. For now, just remember: Canadian PSE is well-funded and it has among the most equitable outcomes of any system in the world. We’re doing well, guys. Let’s keep it up.

