


Just a quick one today on student debt and why it hasn’t been increasing.
So, under conditions of near-total secrecy, Statistics Canada last month published the results of its National Graduate Survey for the Class of 2020. One of the most awaited numbers in this survey are those relating to student debt. With so many folks always assuming that student debt is “skyrocketing,” it is always a good opportunity for myth correction.
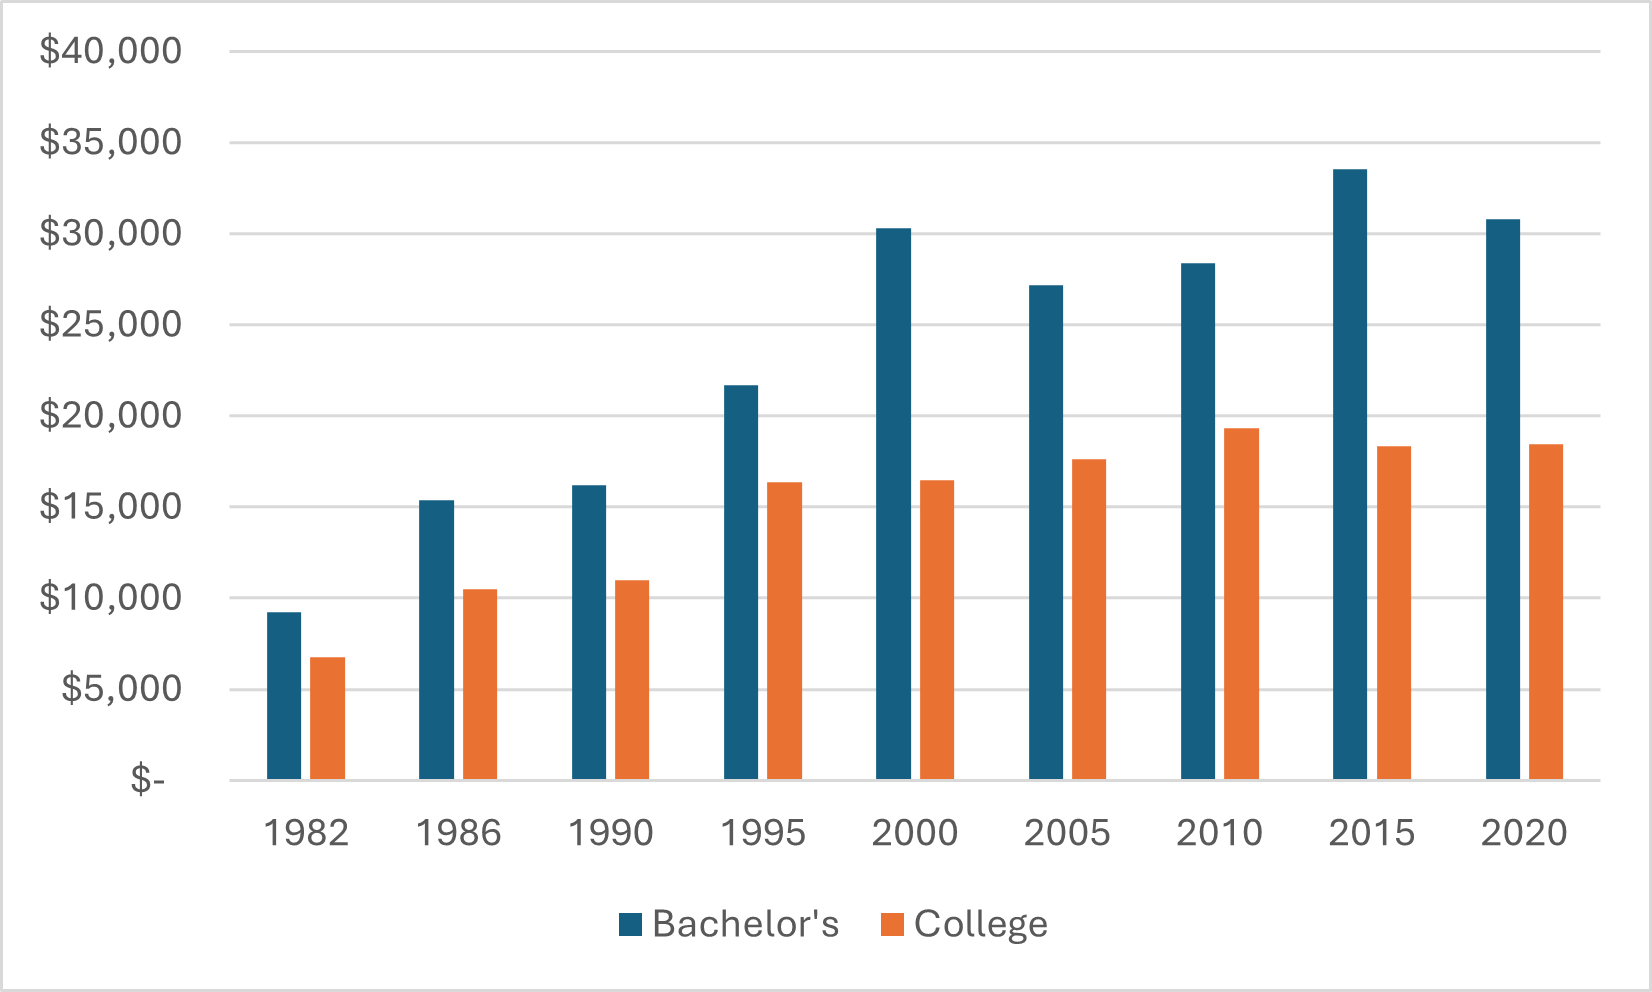
For you see: student debt is not skyrocketing. It’s almost exactly where it’s been for about the last 20 years. Figure 1 shows total student debt from all sources at graduation, for bachelor’s recipients and college diploma recipients. The big “revolution” in student debt occurred in the 1990s, when average levels of debt doubled. Since 2000—that’s 20 years now, folks—student debt has stayed roughly even in constant dollars.
Figure 1: Average Debt from All Sources at Graduation Among Students With Debt, by Type of Credential, National Graduates Survey 1982-2020, in $2021.
But wait, you say. That’s just the debt levels of those graduates who had debt. Maybe the debt crisis is showing up not in average levels of debt, but in the percentage of people choosing to borrow!
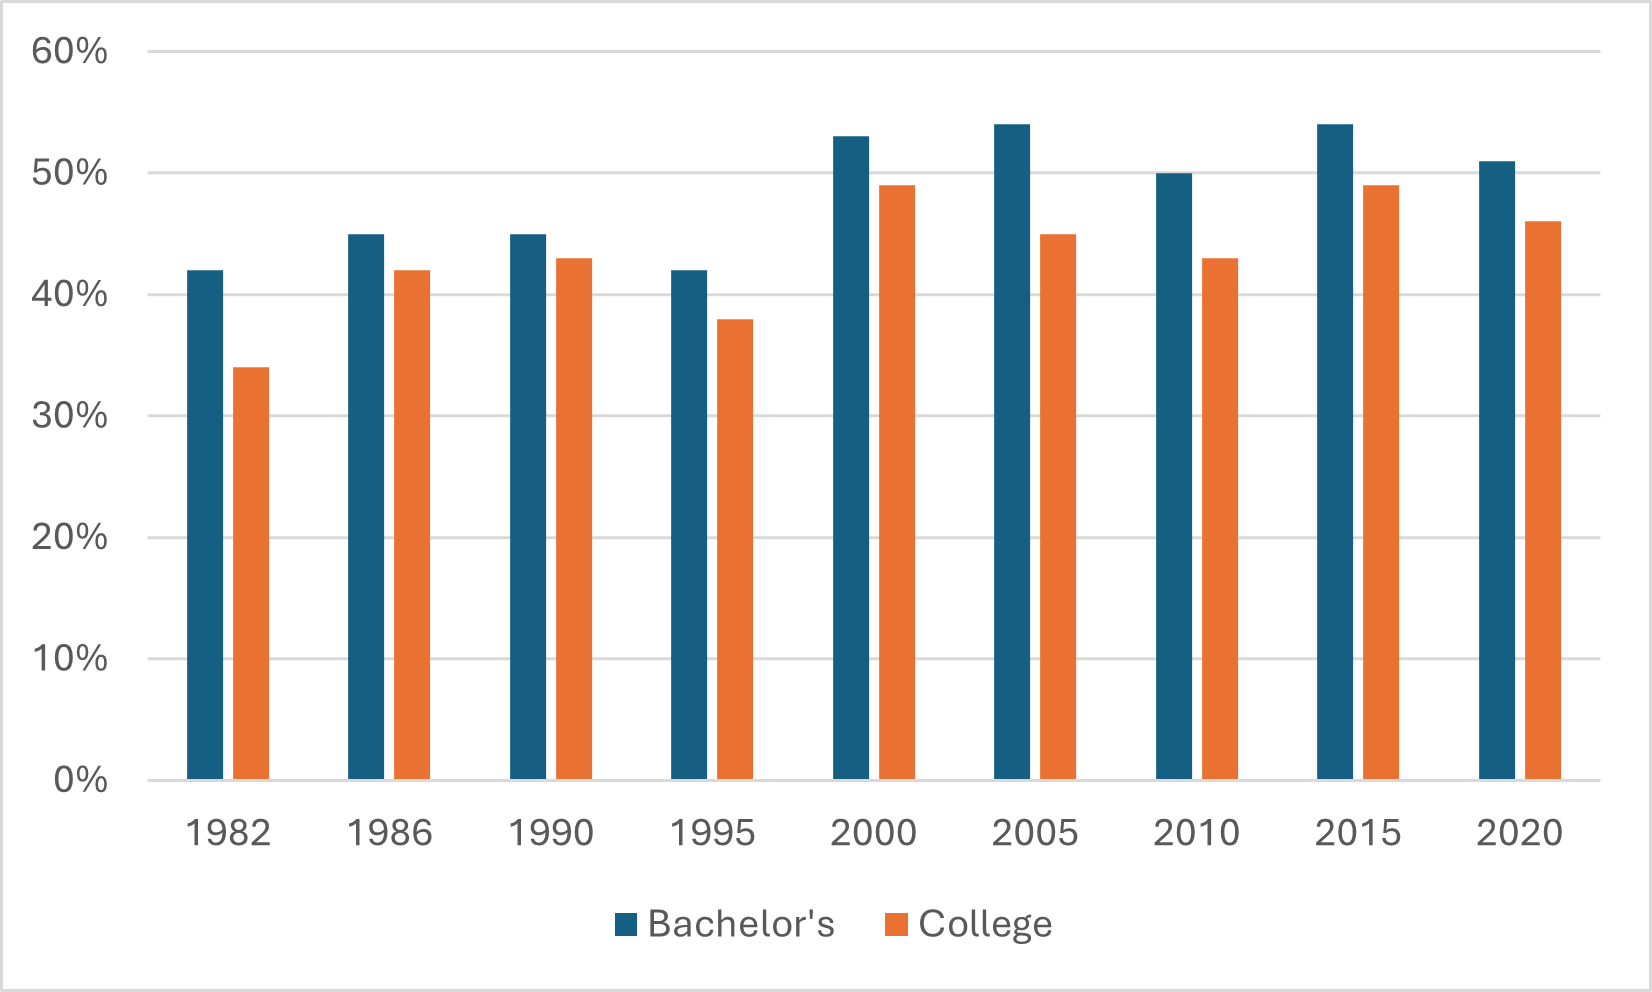
Reasonable thesis. Except: nope. Again, there was an increase in borrowing over the course of the 1990s, but since 2000, the proportions of students borrowing has been pretty consistent, with numbers bouncing around the low-to-mid-50% range for university students and the mid-40%s for college students.
Figure 2: Percentage of Students with Debt, by Type of Credential, National Graduates Survey 1982-2020
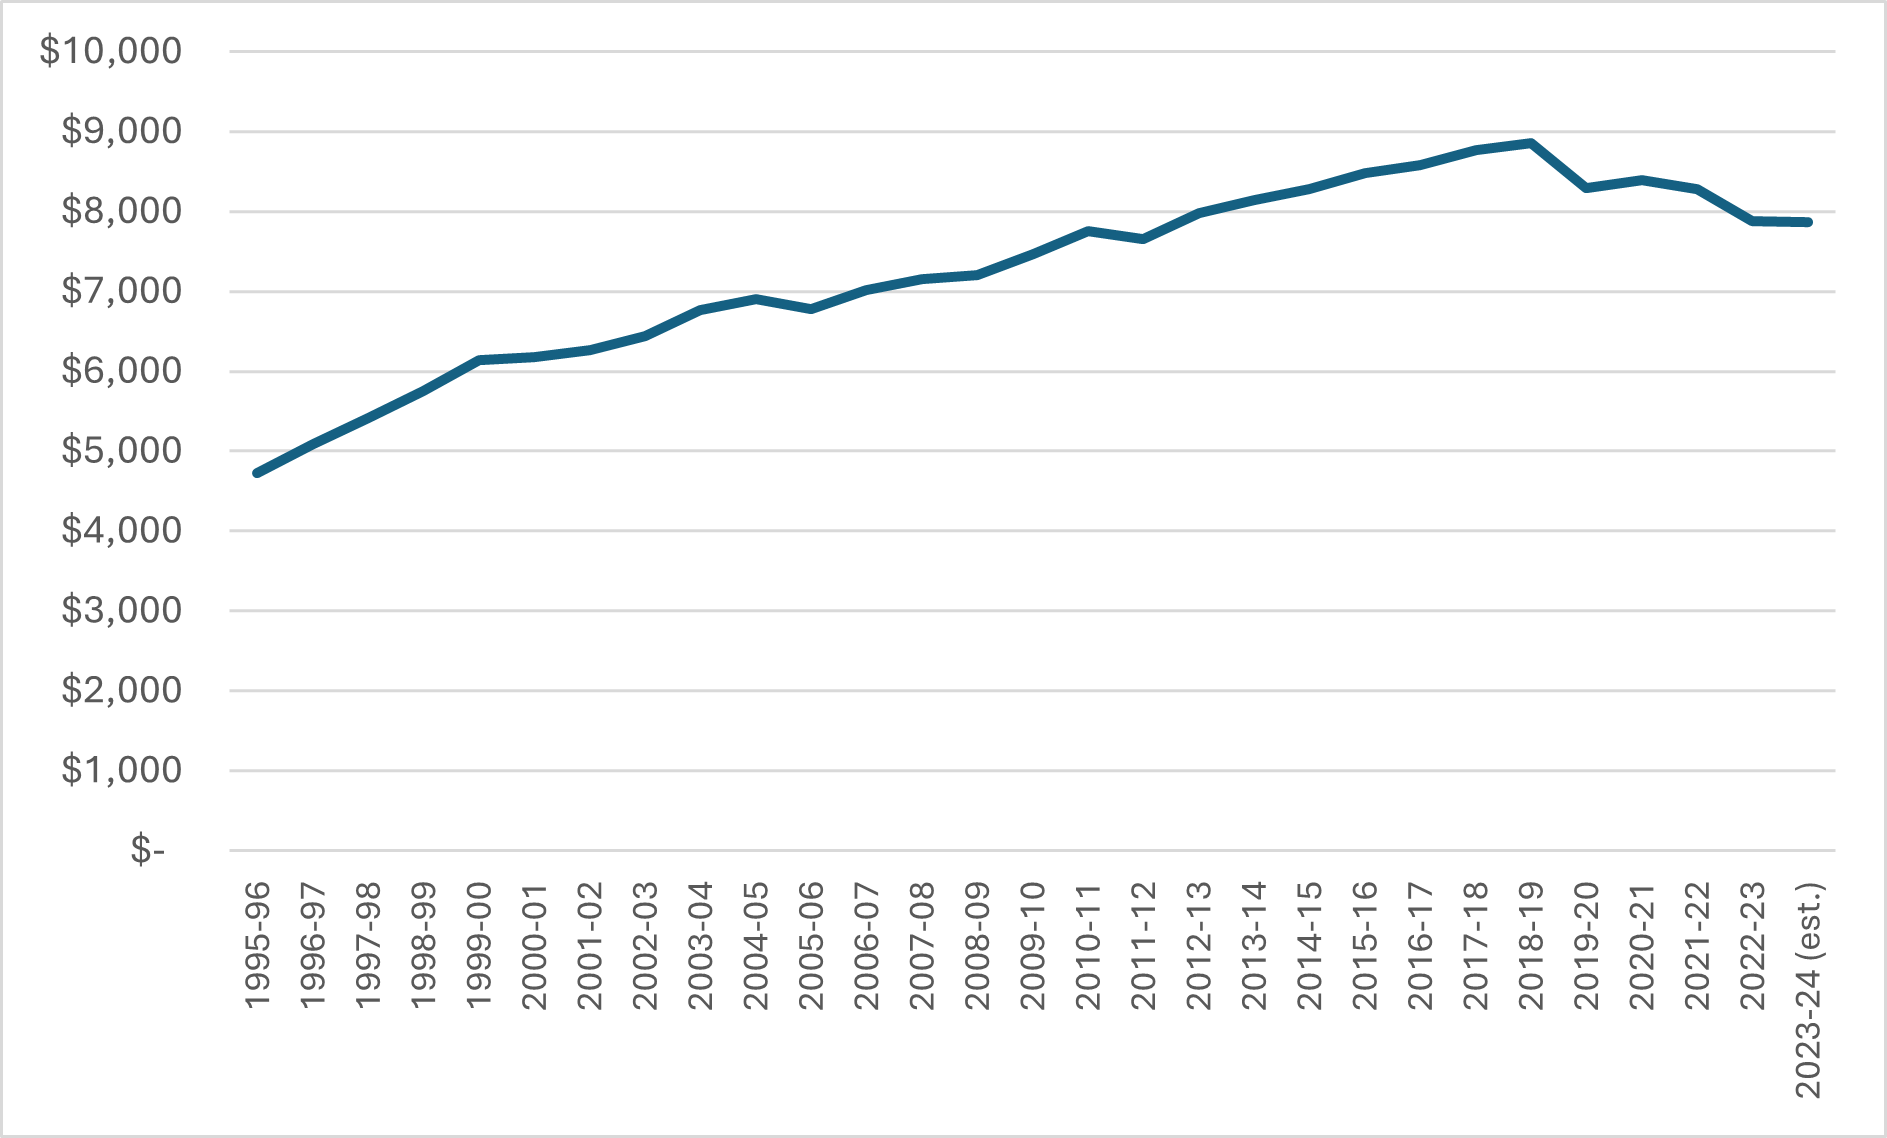
How can this be, you ask? What about all those tuition increases? Well, yes, nationally, tuition is up in real terms, albeit these increases have gone into reverse in the last few years, thanks mainly to the actions of the Ford government. So the increase in fees between 2000 and 2020 is only about 30% in real terms. And since tuition is less than half of overall student costs, you shouldn’t assume that this level of costs—even holding income constant—assessed need would have risen all that much.
Figure 3: Average Undergraduate Tuition, Canada, 1995-96 to 2023-24
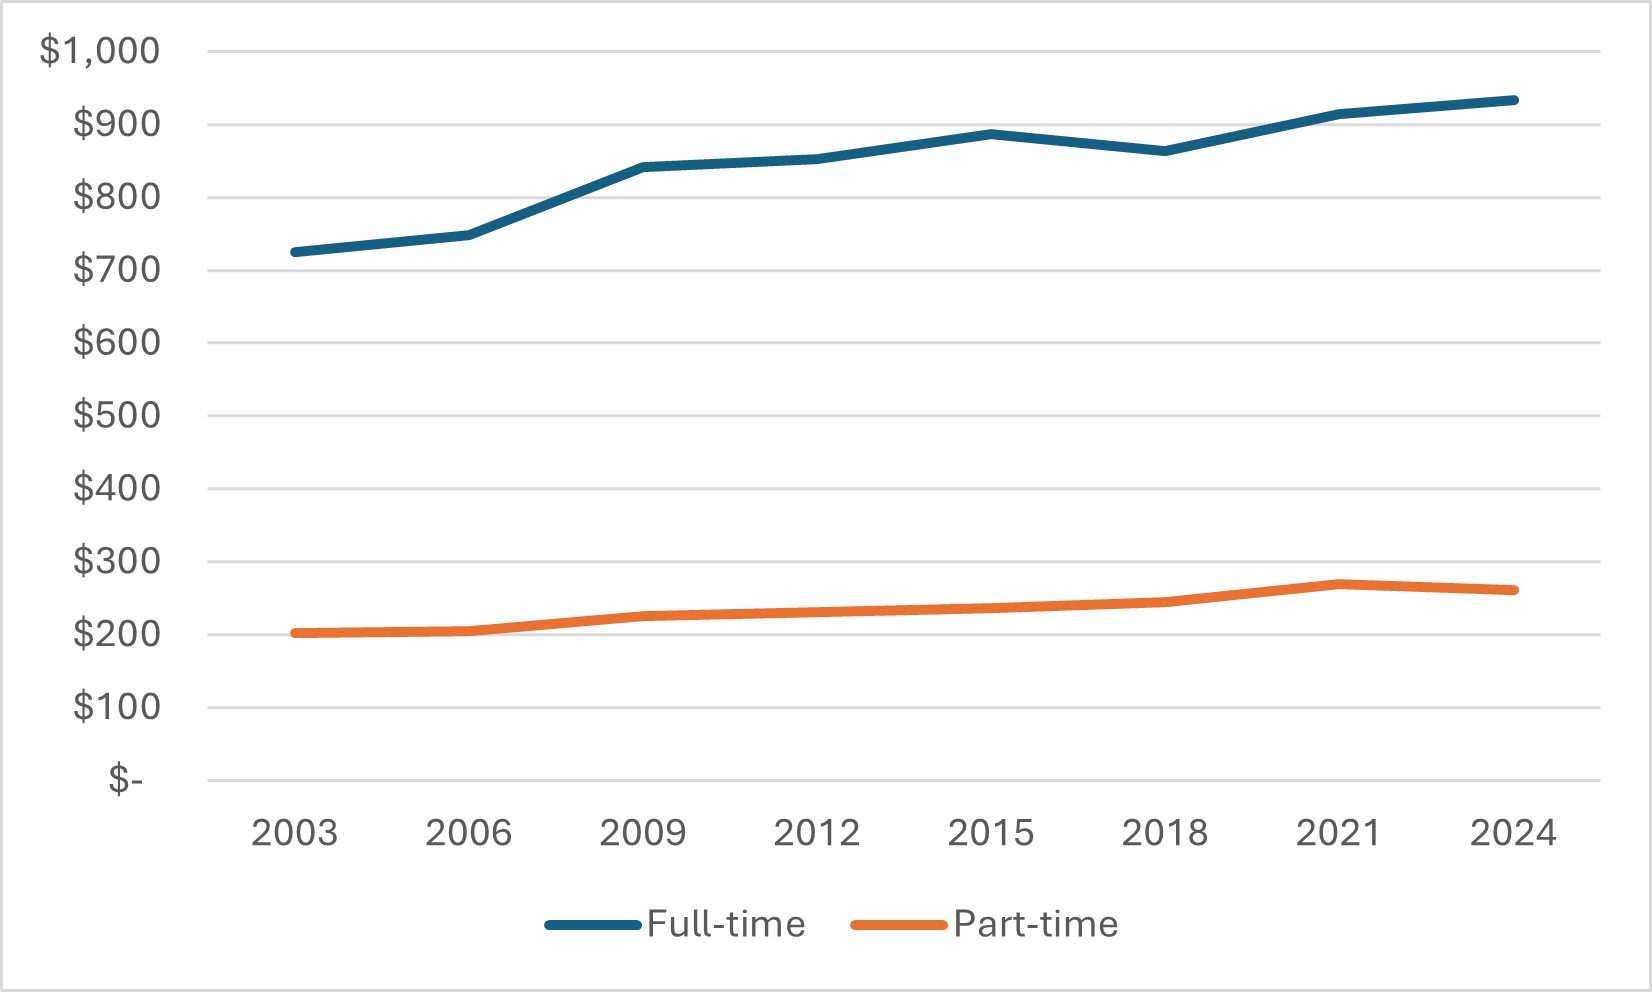
And of course, as I showed a few weeks ago, student income probably isn’t constant: in fact, average weekly wages seem to have risen by about 29% in real terms over the past two decades, both for full- and part-time youth workers.
Figure 4: Average January Weekly Wages, 15-24 year-olds, by Work Status, 2003-2024, in real $2023
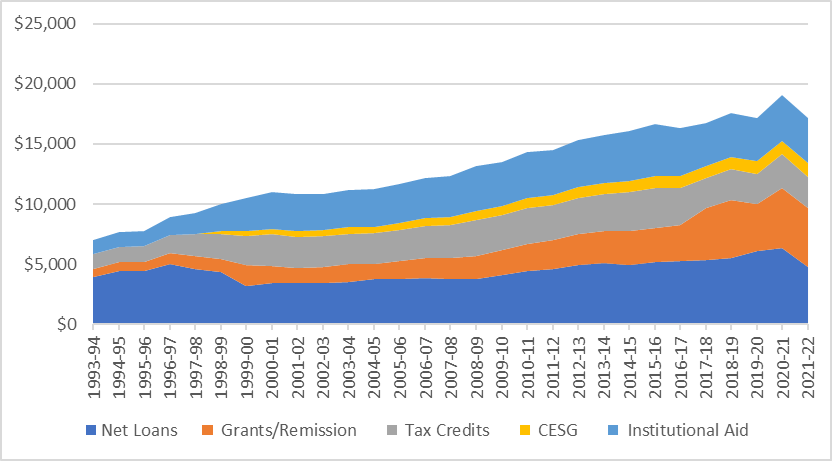
In addition to this, there has been a simply massive increase in various types of non-repayable aid. In 1998-1999, grants to students were just $1.1 billion/year (in $2021 dollars). In the period 2017-2022 the average was over $4 billion per year. Add in all the other forms of non-repayable aid, and you see an increase from about $5 billion to $12 billion. Not all of this is displacing loans, but enough of it is that it’s easy enough to see how loan expansion has been halted.
Figure 5: Total Student Assistance by Type 1993-94 to 2021-22, in Millions of $2021
So that’s why student debt is not increasing: work income and non-repayable aid are both up significantly more than tuition. On the whole, they are therefore doing better on average than they used to (and that’s not even getting into an eased student loan burden through lower taxation, lower interest rates, and a Repayment Assistance Program which is almost unimaginably more generous to borrowers in repayment than the system that was in place 20 years ago).
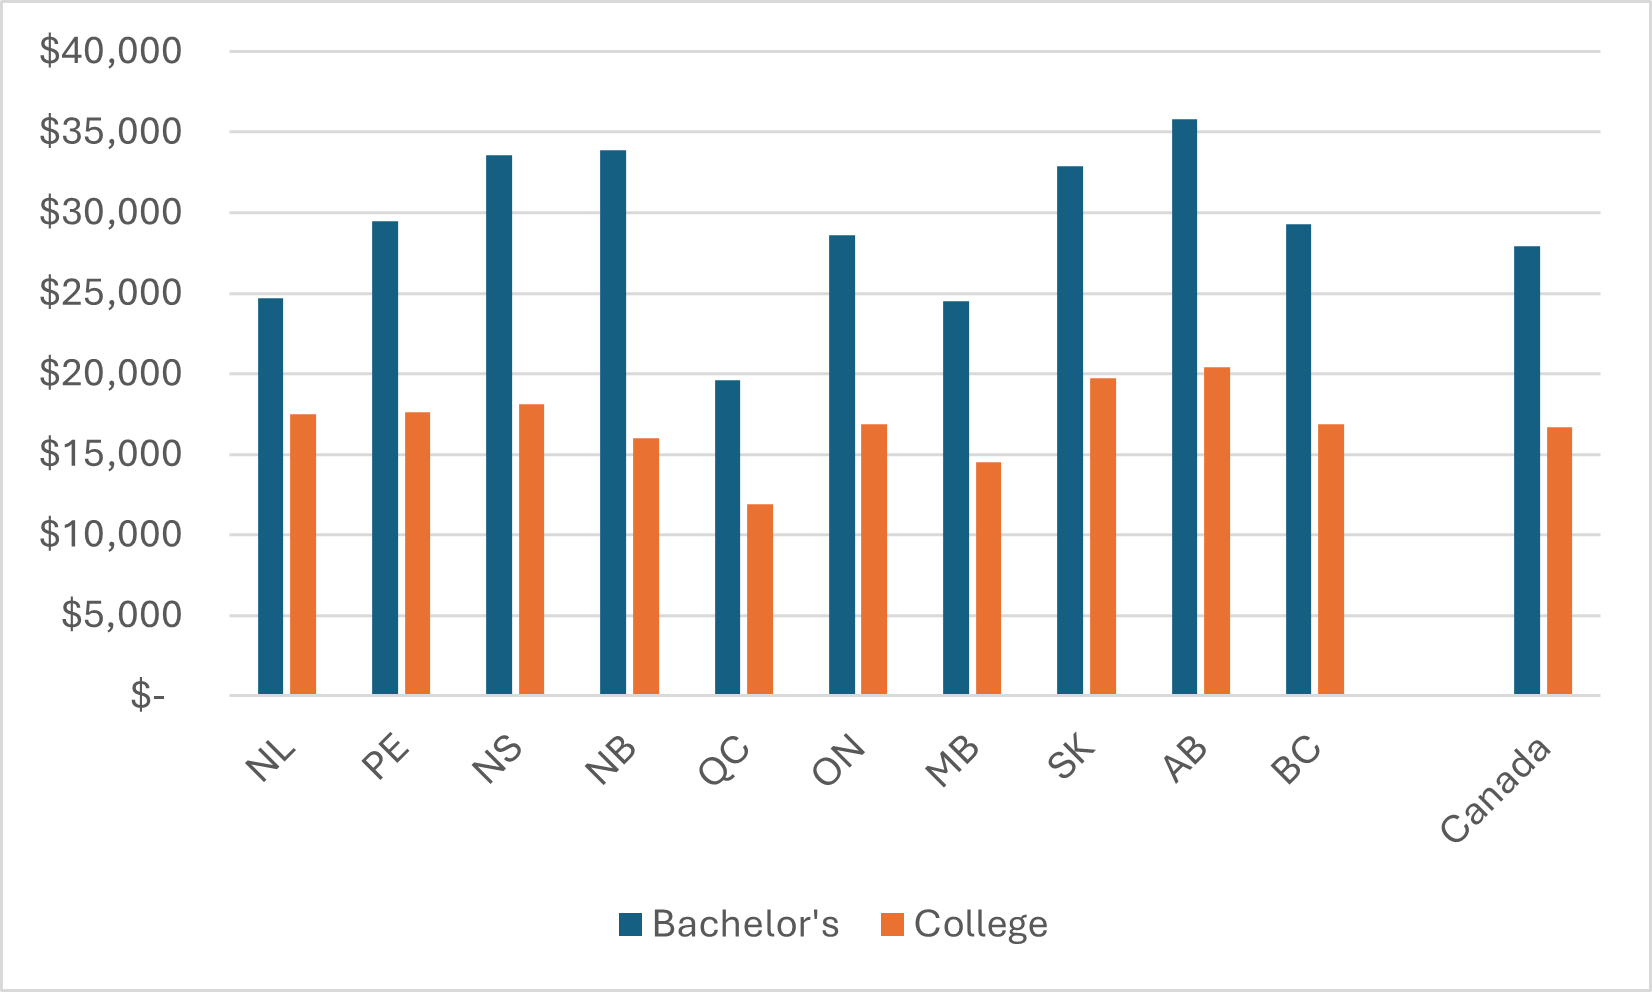
Of course, averages can hide what’s going on at both the high and low ends. Figure 6 shows average debt for college and university students by province. It shows about what you’d expect: debt is lower in provinces with lower tuition fees (Newfoundland and Labrador, Quebec, and Manitoba) and higher in those with high tuition fees, like Nova Scotia. The interesting contra cases are Ontario (where tuition was very high in the late 2010s but debt is actually close to the national average), and Alberta, which was essentially the opposite (medium tuition fees and the highest debt in the country).
Figure 6: Average Debt from All Sources at Graduation among Students with Debt, by Province and Type of Credential, Class of 2020
Why are they contra cases? The answer is pretty simple: student aid. Ontario in the late 2010s was plowing absolutely unprecedented sums into student aid because of its targeted free tuition promise. Alberta, meanwhile, created effectively unlimited demand for student loans in 2010 by eliminating the parental contribution requirement, thus driving up need and hence loans. The NDP government of Rachel Notley did exactly the wrong thing to counter this rise in student loans debt: they froze tuition but did not introduce more non-repayable assistance to help those with high debt. The UCP has been no better of course, but their impact on the 2020 number was negligible: almost all of the debt acquired by the class of 2020 was acquired under the UCP.
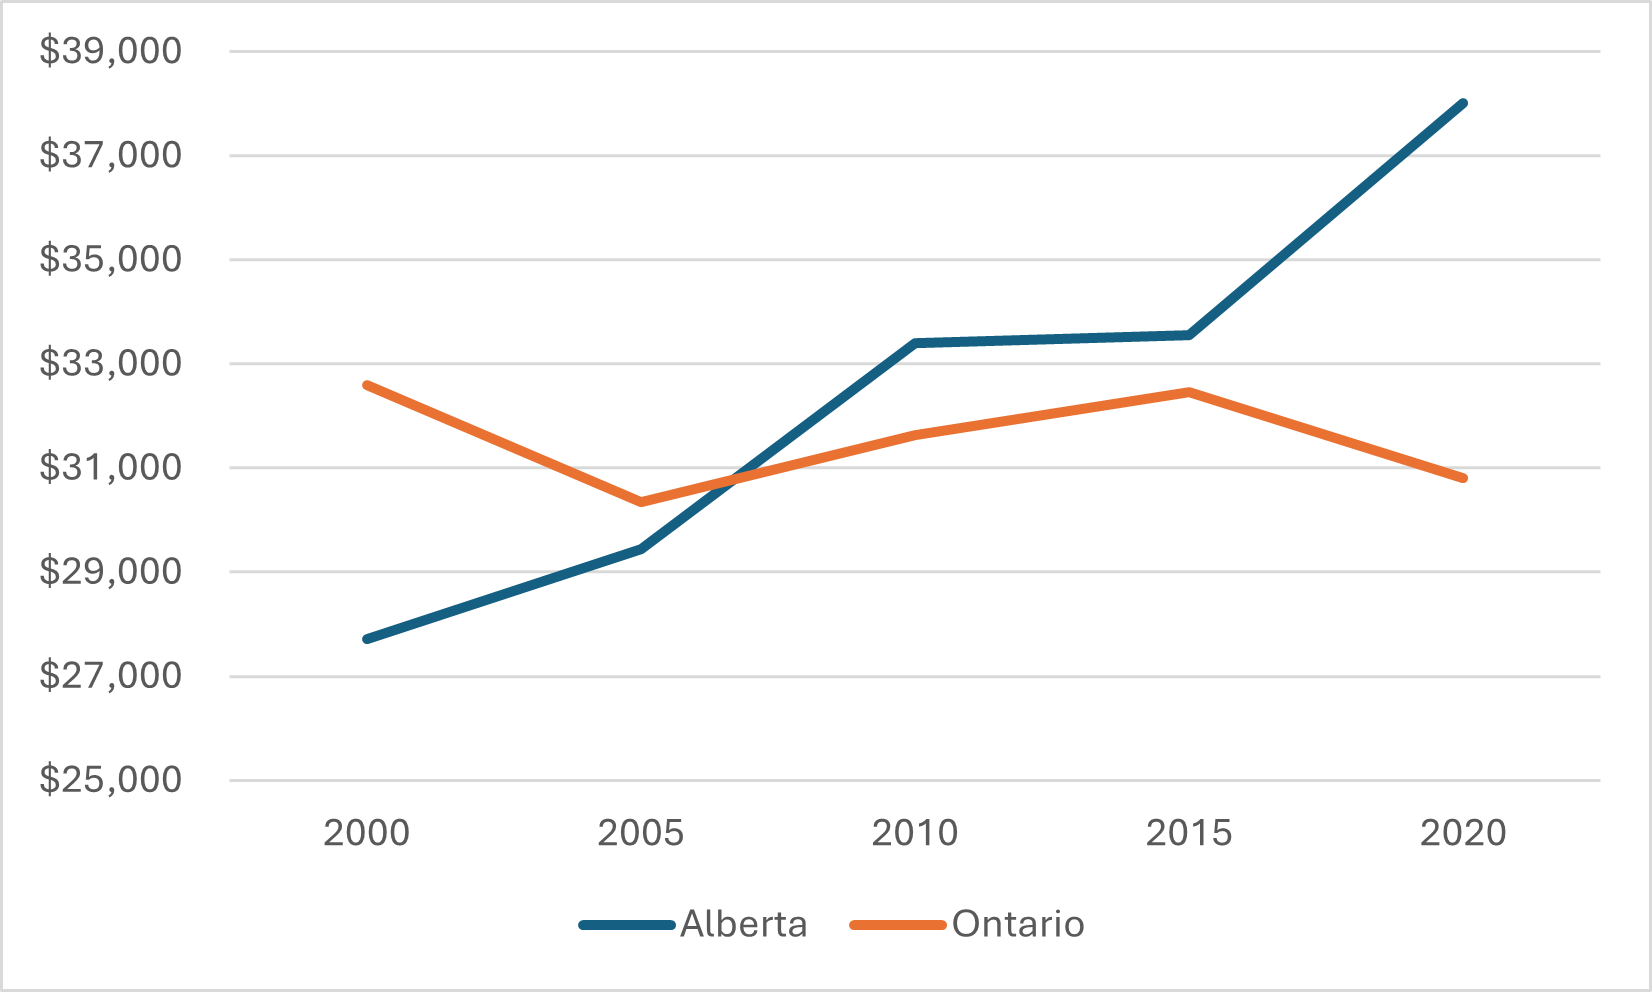
Basically, the story of Alberta vs Ontario is the story of massively targeted assistance vs. massively untargeted assistance. Take a look at Figure 7: which one of these would you prefer?
Figure 7: Average Debt, among Bachelor’s Graduates with Debt, Alberta vs. Ontario, National Graduates Survey 2000-2020, in $2020
Tomorrow: why the era of stable student debt might be coming to an end.


One Response
Fascinating numbers, but they do not tell the whole student debt story.
At the Ontario college where I work, over 55% of the student body (and I am not including the 6,000 students attending the Public-Private Partnership storefront in Toronto) are international. Do they have student debt? Oh yes — just ask them. And most of them wish to graduate, acquire PGWPs, and eventually permanent residency. All while repaying student debt in their countries of origin — the kind of debt StatsCan cannot track for obvious reasons. There’s a whole lot of people with a whole lot of student debt, even if this debt is invisible.