


I was playing around with Labour Force Survey data this past weekend (as one does) and found some stuff worth sharing. Ready? Let’s go.
First, let’s look at student employment rates. One of those things that “everyone knows” is that student employment levels are continually rising. Bur in fact this is anything but true: data shows that the employment rate of full-time students, at around 40%, is pretty much what it has been since the turn of the century. There was an increase, but it took place over 30 years ago, in the decade or so before 1990. Part-time students, on the other hand, saw a decline in employment rates in the 1980s, but has stayed constant at around 70% ever since.
Figure 1: Post-Secondary Student Employment Rates During School Months by Student Status, 1976 to 2023
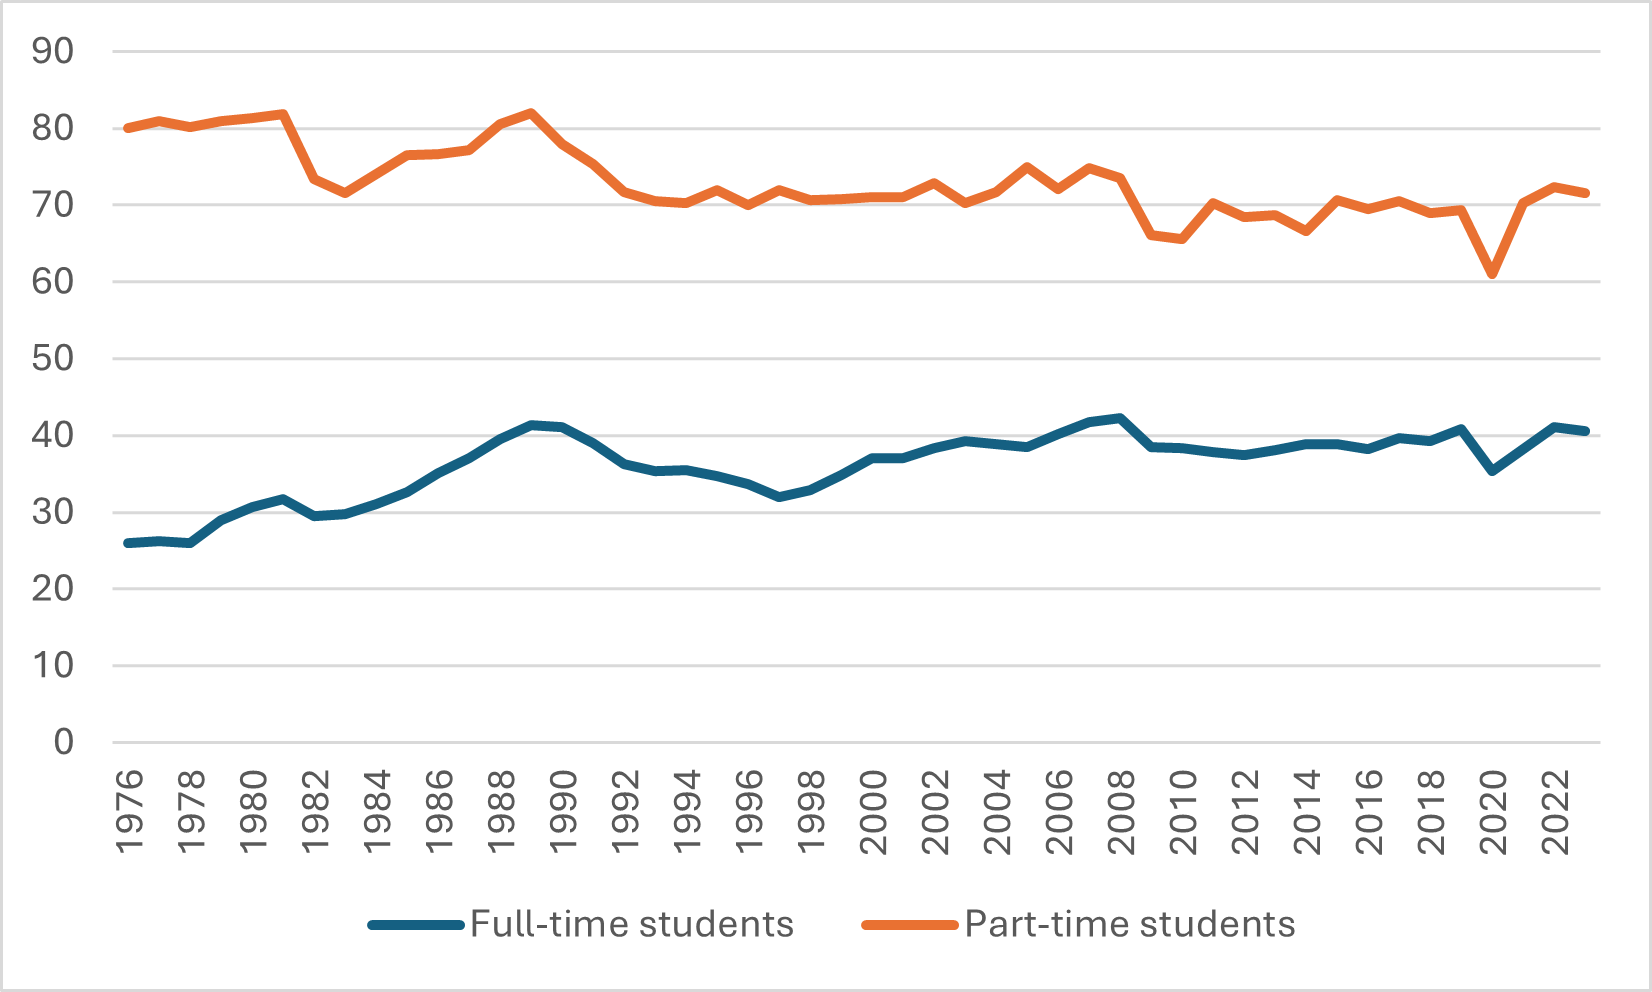
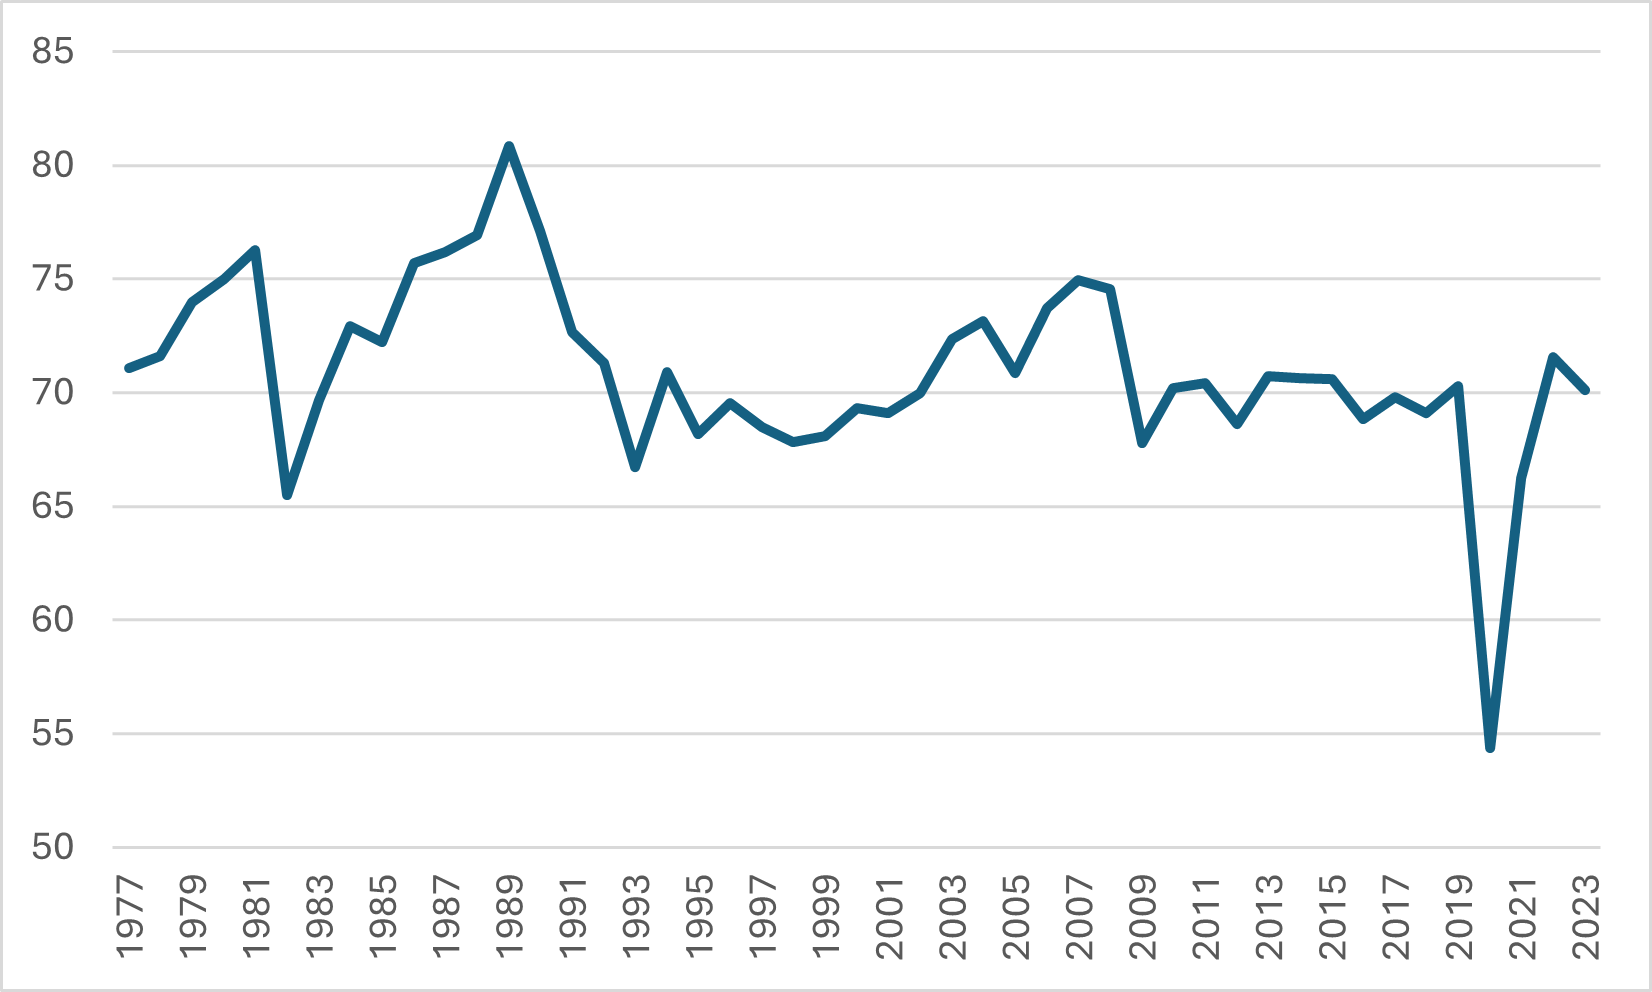
Figure 2 shows rates of summer (technically, June through August) employment rates for returning full-time students since 1977. Again, what we see is generally elevated rates in the 1970s and 1980s (apart from 1982, which was a truly godawful year), which fell in the recession of the early 1990s, but has then stayed more or less steady at 70%, apart from a couple of boom years in the mid/late 2000s and of course during COVID.
Figure 2: Post-Secondary Student Employment Rates During Summer Months, 1976 to 2023
Maybe the most interesting thing I found in my little foray was employment rates by province, which I reproduce below in Figure 3. Generally speaking, whenever you look at employment data, you tend to see higher rates out west than out east—it’s just how employment has been distributed across this country for the past five decades or so. But here, we see that summer student employment displays the reverse pattern: no province west of the Ottawa river has a summer employment rate higher than any province east of it. Ontario in particular has low summer employment rates.
Figure 3: Post-Secondary Student Employment Rates During Summer Months by Province, 2023

What explains this? Well, hard to know for sure, but my first guess would be that it is a function of the availability of summer classes. These offerings are more plentiful at big institutions (more plentiful in Ontario and the west) than at small ones (the dominant form in the Atlantic provinces). This might mean that students further west are simply more likely to be studying rather than working because they have the opportunity to do so. We can’t know for sure because no federal or provincial authority reports summer enrolments, but it more or less fits the data (although Quebec would still be anomalous).
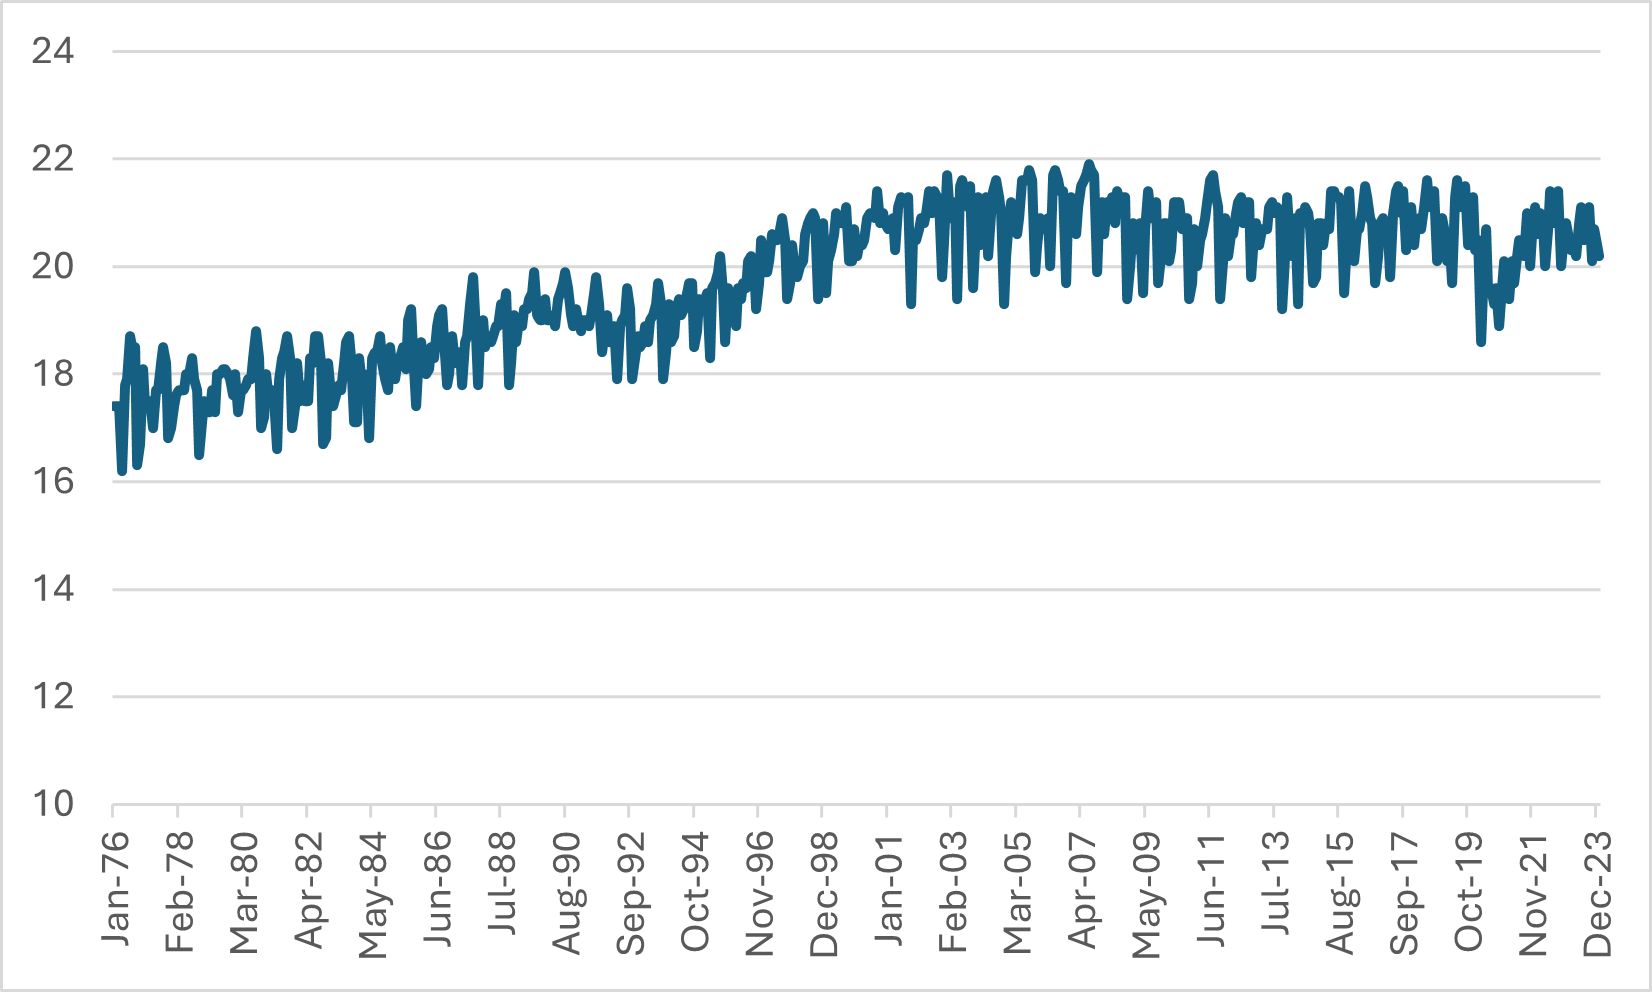
There is also the question of how many hours students are working. Unfortunately, this data is not available from Statistics Canada’s public data so we have to look at the nearest proxy: hours worked by part-time workers between the ages of 15 and 24. Since students make up more than half of all such workers, this is not terrible—it would be difficult (though not impossible) to imagine circumstances in which the average for students specifically would be moving in a different direction from that of the age-range as a whole.
Figure 4 shows the results of this exercise. This line is pretty jagged, mainly because average work hours fluctuate a bit within the year. As with previous graphs above, we see that there was a change in the pattern of hours worked: average hours worked per week increased from about 17 to 21 between 1976 and the turn of the century. But since then, COVID apart, hours worked have been almost unchanged.
Figure 4: Average Hours Worked Per Week, Part-time Workers Aged 15-24
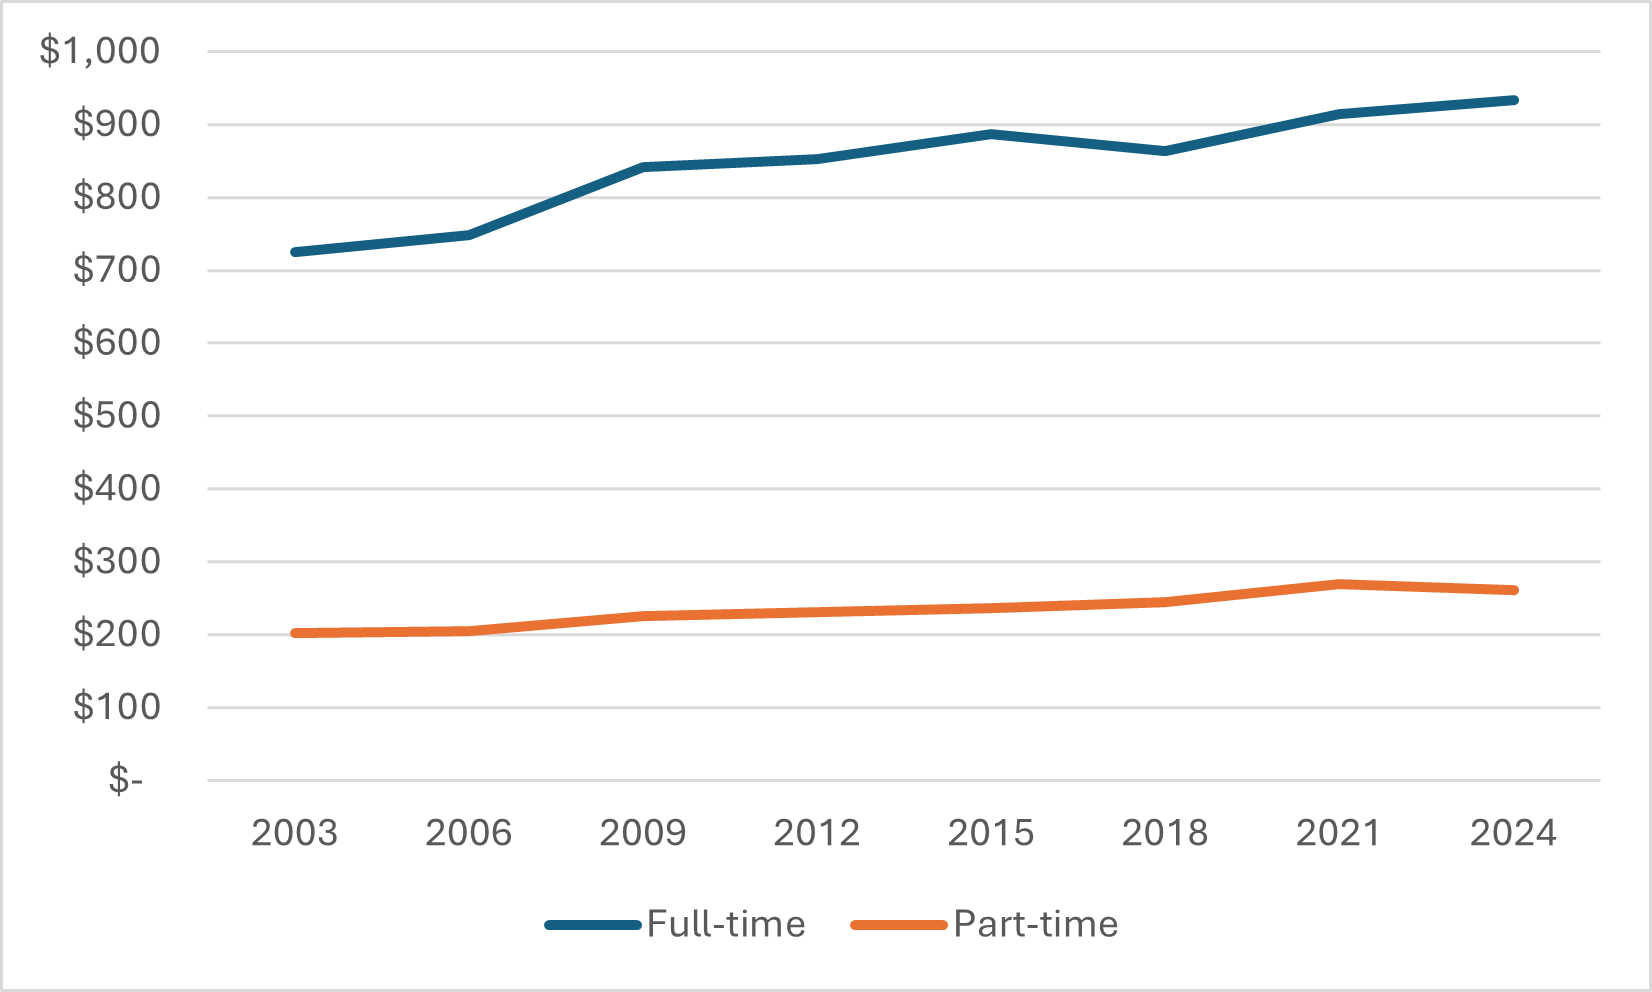
And finally, let’s get to earnings and wages. Again, we’re restricted to total weekly wages for all 15–24-year-olds, but whatever the trend is here is likely the same for students specifically. Figure 5 shows that pay packets for both full- and part-time workers are up 29% over the past two decades, even after controlling for inflation (and no, this isn’t about working more hours—figure 4 shows that’s not true for part-time workers, and it’s not true for full-time workers either). For comparison, tuition is up only 16% in real dollars since 2003 and students grants are up four-fold in that time as well.
Figure 5: Average January Weekly Wages Earned by 15-24 year-olds by Work Status, 2003-2024, in real $2023
In other words: student work patterns did change in the 80s and 90s, but they have been remarkably stable ever since then. And over the past 20 years, students have gradually been getting paid more for their efforts. As I said: on the whole, it’s good news.

