Yesterday I offered my thoughts on some of the highlights from the international portion of the PIAAC release; today I want to focus on the Canadian results.
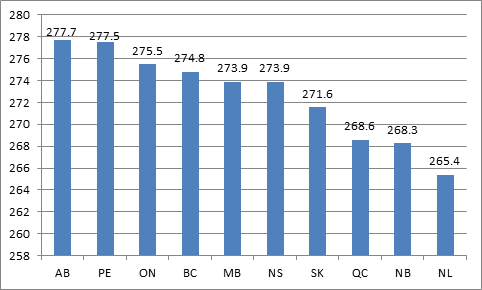
Figure 1 shows the overall literacy scores, by province.
Figure 1: Literacy Scores by Province, PIAAC
At first glance, PIAAC doesn’t seem to be telling us anything we didn’t already know from years of PISA & TIMSS surveys. Alberta comes first, the Atlantic is mostly a mess, and everybody else is kind of in-between. But look a little more closely at the data, and a different story emerges. Remember that PISA and TIMSS are single-cohort snapshots of kids with identical amounts of education; PIAAC is a mashup of multiple cohorts, each with quite different educational patterns. Because they are measuring such different things, similarities may simply be coincidental.
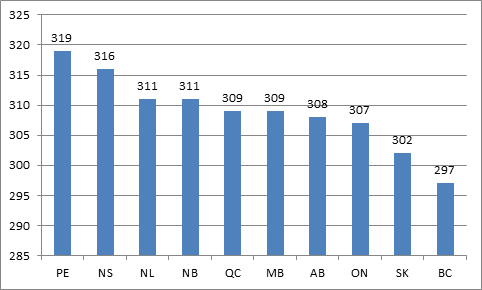
So let’s see what happens when we try to standardize for age and education. Figure 2 shows PIAAC literacy scores, by province, for the 25-34 age cohort who possess a university degree:
Figure 2: Literacy Scores by Province, University Graduates Aged 25-34
At face value, Figure 2 is pretty exciting if you’re from the Atlantic. I mean, hey, OECD says one year of schooling is equal to seven points on the PIAAC scale – which implies that Islanders with university degrees, on average, have literacy rates equal to about three years of extra education over the left-coasters. But because of sample sizes, these numbers come with pretty big confidence intervals: PEI and Nova Scotia are outside the margin of error for BC and Saskatchewan, but not for anyone else. The other six are all essentially equal.
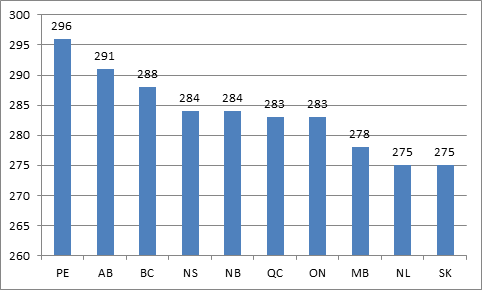
Now take a look at the result for college graduates, aged 25-34:
Figure 3: Literacy Scores by Province, College Graduates Aged 25-34
There’s a similar pattern here, but the gaps at either end are bigger, and confidence intervals don’t help quite as much. BC through Manitoba are all within each others’ margin of error. Put PEI and Alberta are genuinely ahead of everyone else, except BC; Newfoundland and Saskatchewan come out looking bad no matter what.
Here’s what you should take from this:
1) Alberta’s overall high PIAAC scores are due less to its own education system, and more to its ability to attract talent from elsewhere. That’s the only way you can reconcile their own scores with what we know about their PSE access rates, and the performance shown in the second and third figures above.
2) Saskatchewan needs to ask some hard questions. Really hard.
3) PEI is… odd. This doesn’t look like a fluke. But then, if they’ve got all these great skills, why is their economy such a basket case?
4) Newfoundland is Newfoundland. Decades of relative poverty will take its toll.
5) Don’t get fooled by small differences – the other six provinces are essentially indistinguishable from one another.
More tomorrow.


 Tweet this post

Alex,
There may be a co-variate for the College and University students in Sk that you are not accounting for. I don’t have the numbers off hand but isn’t the socio-economic backfounds of the student body at SIASTs and U of R/U of S markedly different than that for the other provinces?
I would also note as someone who taught in the Belgium university system, these survey results reflect my personal experience with the exceptional nation of Flemish University students.
Hi Steven.
I wouldn’t have thought the SK population was *that* different fro other provinces. Certainly not from neighbouring MB, anyway, which seems to do better.
The PEI results are a bit boggling, though we are a great little university here at UPEI (shameless plug).
My suspicion, without cheating and looking at the further results (though thanks for the link) is that its sort of the opposite of the Alberta phenomenon. There’s a huge outflow of University grads from PEI, and what’s left is probably selective. My suspicion is it’s more Arts types who don’t see great prospects elsewhere. I’ll be interested to see if we score as high on numeracy and problem solving.
Hi Jim. Selective in that the *less* skilled ones leave? You think?
Thinking a different skill set leave, Business, Science, engineering, economics, while those literate english and history grads stay home.
Gotcha. Understood.
This is the same problem that the IALSS had – it is not a test of ‘literacy,’ it is a test of official language proficiency. Provinces such as BC have a high proportion of university educated immigrants – they are literate in their first language, but they may not have strong English language skills.
Can we have an analysis that accounts for that? Also, can we stop calling it a test of literacy?
Hi Ben. I believe if you look at Appendix D of the Canadian report – online at CMEC.ca, they break out by province the scores for people taking it in their first language and those taking it in non-first language. Interestingly enough there are a couple of provinces where people taking it in their second language do better than those taking it in the first.