Morning everyone. Welcome back. Some statistical wonkery today, with respect to the analysis of government expenditures on postsecondary education.
Many of you will recognize Figures 1 and 2 from earlier blogs or the State of Postsecondary Education 2024. They represent the two most-common ways to look at commitments to postsecondary education: the first in per-student terms, and the second in per-GDP terms.
Figure 1: Provincial Expenditures per FTE Student by Sector, 2022-23
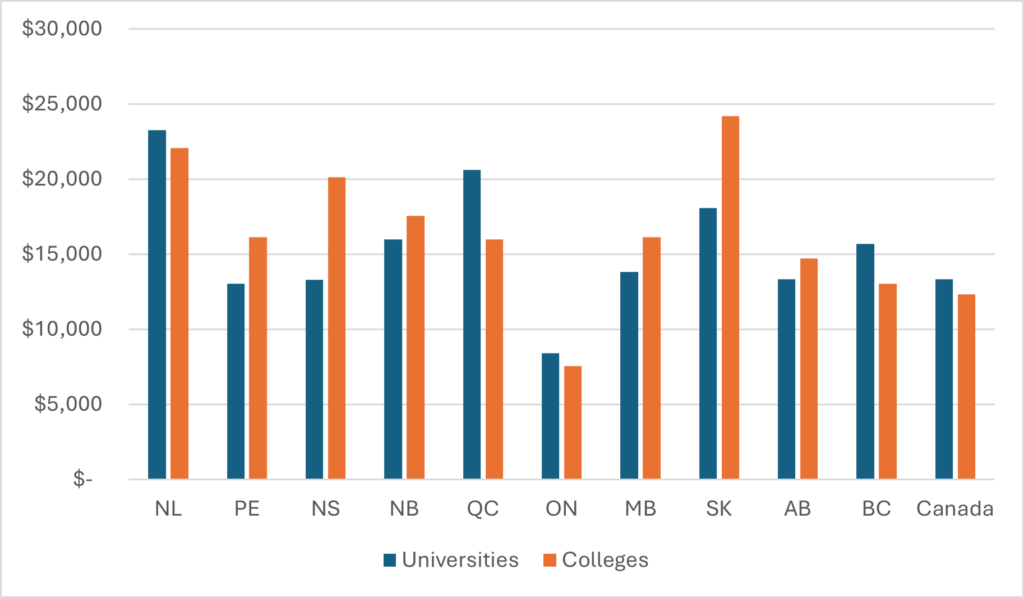
Figure 2: Provincial PSE Expenditures, by Sector, as a Percentage of Provincial GDP, 2022-23
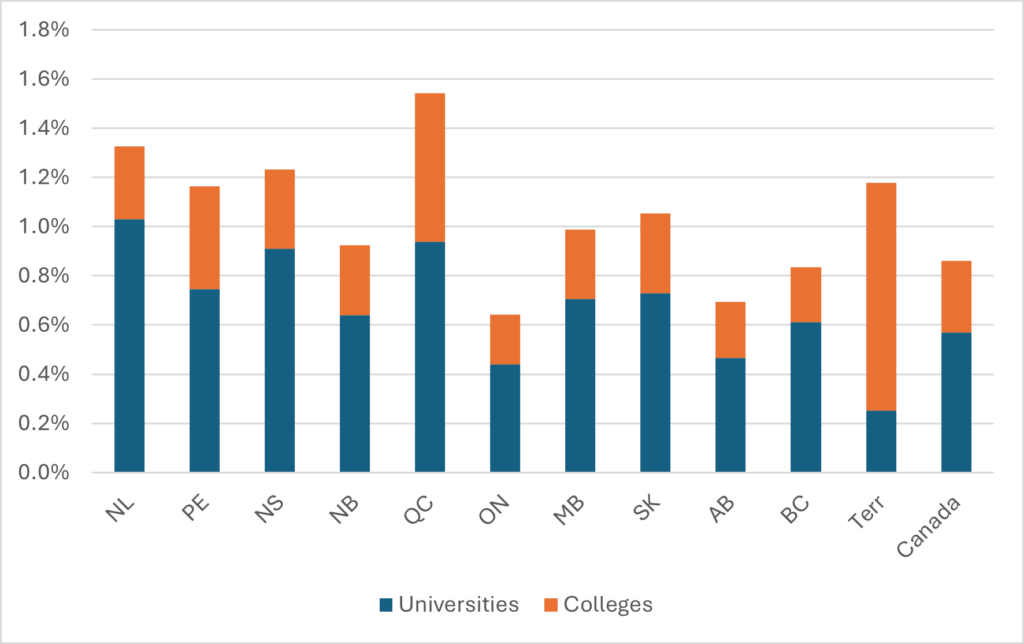
These two approaches have their respective strengths and weaknesses, and not surprisingly they generate slightly different conclusions about how strong each jurisdiction’s efforts are writ to postsecondary education, one focused on the “recipients” of funding (students) and the other focused on the source of the funding (the local economy). Neither is definitive, both are useful.
But there is another way to look at this funding, and that is not to look at how much institutions receive as a proportion of local jurisdictional output, but to look at what percentage of government spending is devoted to educational institutions. Examined over time, this figure tells you the changing status of postsecondary education compared to other policy priorities; examined across provinces, it can tell you which provinces put more emphasis on postsecondary education. Of course, no one tracks this in Canada, because it involves a lot of tedious mucking around in government documents, but what is this blog for if not precisely that? I wasn’t doing anything on my holidays anyways.
So I decided to pair my long-term data series on provincial budgets (the most recent one posted back in April), with a new data series on total provincial spending which I derived simply by looking at consolidated expenditures in each province since 2006 and expressed in these same budgets. Usual disclaimers apply: provincial spending definitions aren’t entirely parallel (or at least they use different words to describe what they are doing) particularly with respect to capital, so inter-provincial comparisons are probably a tiny bit apples-to-oranges even if each province’s data is consistent over time. Take the exact numbers with a grain of salt but I think they will mostly stand up to scrutiny.
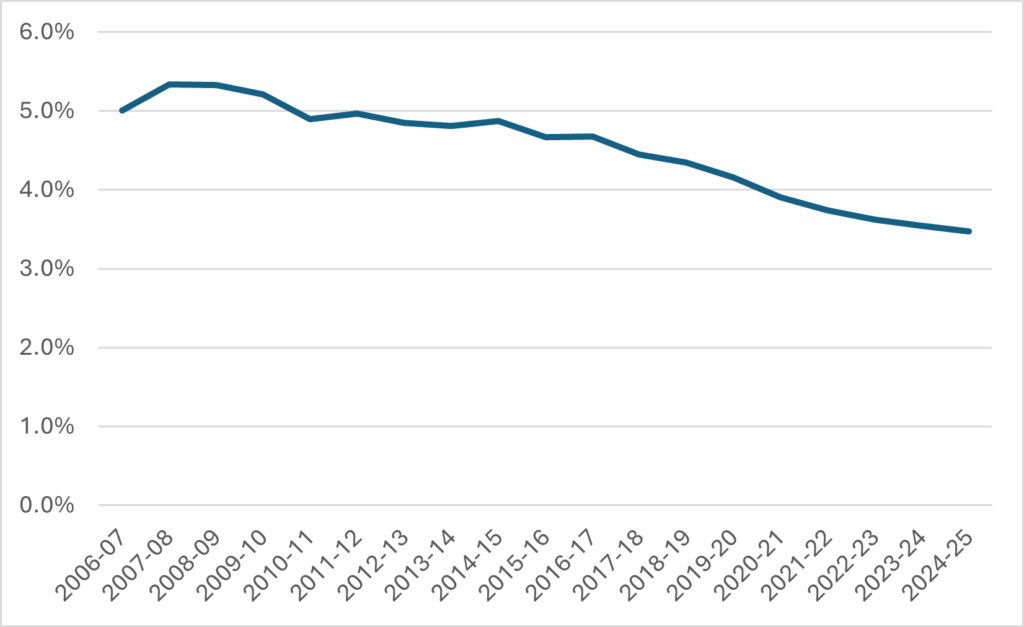
Figure 3 shows provincial transfers on postsecondary institutions across all ten provinces as a percentage of total provincial spending. And it’s…well, it’s not good. As recently as 2011-12, provinces spent five percent of their budgets on postsecondary education. Now it’s three and a half percent. Or to put it another way, as a proportion of total spending, it’s down by about thirty percent.
Figure 3: Provincial Spending on PSE as a Percentage of Total Provincial Spending, Canada, 2006-07 to 2024-25
Is this due to particular events in particular provinces? Not really. Let’s just take a look at the four big provinces (which make up 85% of the postsecondary system. The provinces all started in different places (Alberta, famously, spent a heck of a lot more than other provinces back in the day) and the slope of decline is gentler in Quebec than elsewhere, but the basic path of decline and the eventual destination is similar everywhere. Notable by its absence in any of the four provinces are any clear break-lines which coincide with a change in administration—these declines are pretty consistent regardless of whether governments are left, right, or centre. It’s not a partisan thing.
Figure 4: Provincial Spending on PSE as a Percentage of Total Provincial Spending, Selected Provinces, 2006-07 to 2024-25
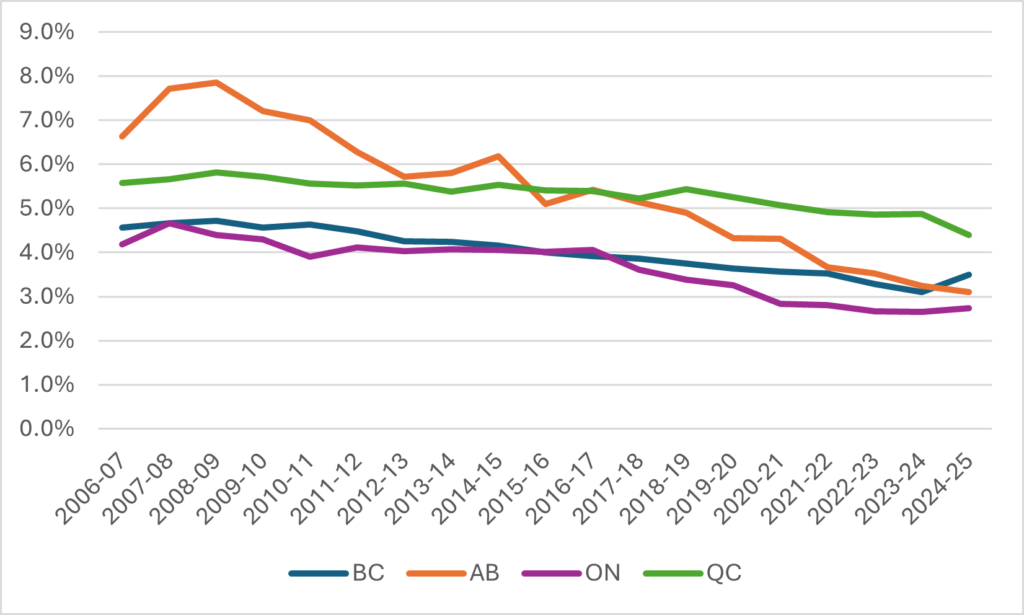
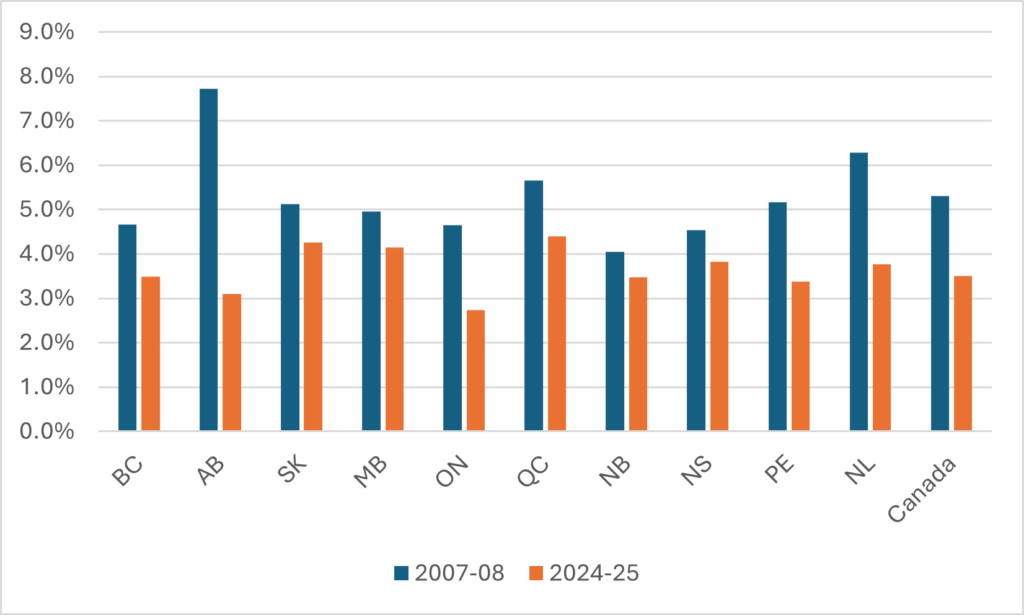
Figure 5 shows each province’s performance both in 2006-07 and 2024-25. As can clearly be seen, every province saw a decline over the 18-year period. This was not especially driven by one or two provinces: all provinces seem to have come to an identical conclusion that postsecondary institutions are not worth investing in. The size of whatever drop was in most cases inversely proportionate to how high spending was back in the initial period. The biggest drops were in Alberta and Newfoundland, which back in the day were the two highest spenders, riding high as they were on oil revenues. The smallest drop was New Brunswick, which was the weakest performer back in 2006-07. Ontario…is Ontario. But basically, the entire country is converging on the idea that investments in postsecondary need to be in the 2.5%-4.5% range rather than in the 4-7.5% range as they did 20 years ago.
Figure 5: Provincial Spending on PSE as a Percentage of Total Provincial Spending, by Province, 2006-07 vs 2024-25
Now, the obvious conclusion you might draw from this is “hey! Huge declines in public support for public postsecondary education!” But this is not quite correct. Remember: these are ratios we are looking at. Some of the delta will be due to changes in the numerator, some will be due to changes in the denominator. Figure 6 shows changes in both postsecondary spending and total provincial spending. And what’s clear is that the changes we have been examining in Figures 3 and 6 have more to do with the expansion of total spending rather than a decline in PSE spending.
Figure 6: Real Change Provincial Spending on PSE Institutions vs Real Change Total Provincial Spending, Canada, 2006-07 to 2024-25 (2006-07 = 100)
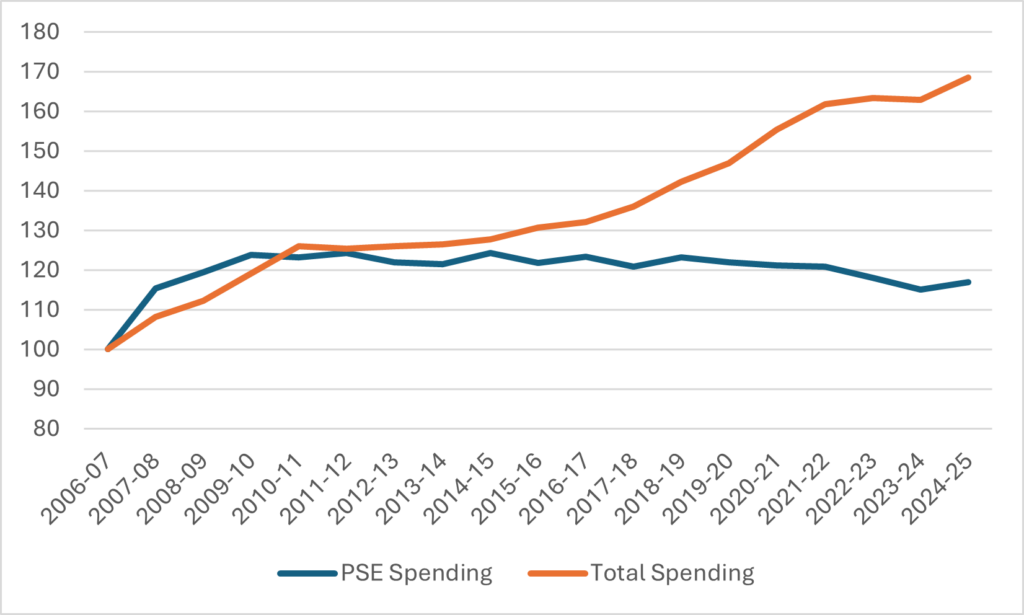
That increase in provincial spending in the last decade—30% over and above inflation—is wild. And deeply inconvenient for anyone who wants to build a narrative around generalized “austerity.” But what is clear here is:
- transfers to universities and colleges have trailed provincial spending everywhere and without reference to ideology of the governments in question, and
- ii) if transfers had not trailed general spending, they would be roughly $9.5 billion better off than they are today.
And by a simply *amazing* coincidence, $9.5 billion–in real dollars—is almost identical to the increase in income postsecondary institutions have seen in revenue from international students over the same period (it’s about a $9.2 increase from 2007-08 to 2022-23, the last year for which we have useful data—the 2024-25 is likely somewhat higher but we don’t know by how much).
There a number of conclusions one could draw from this, but the ones I draw are:
- Governments are spending more. A lot more. They just aren’t spending on PSE. Instead, they are spending it on an ageing population and other things that juice consumption. Eating the future, basically.
- The drop in government support for PSE relative to overall spending increases is universal. No government provides any evidence of contrarian thinking. None of them think PSE is worth greater investment.
- Changes of government are also almost irrelevant. They may change the “vibe” around postsecondary education, but they don’t change financial facts on the ground.
- There is a really basic argument about the value of postsecondary education which somehow, postsecondary institutions are losing with governments and, I think by implication, the public. That, and nothing else, needs to be the focus of institutional efforts on external relations.
Provincial governments are eating the future. But the data above, showing that the trend transcends geography and political ideology suggests that at base, the problem is that the Canadian public does not think postsecondary education is worth investing in. Working out how to reverse this view really needs to be job one for the whole sector.
(Or, to be a bit cuter: the sector needs to do a lot less Government Relations and a lot more Community Relations.)

 Tweet this post
