It’s the start of the school year and that’s the best time to examine trends among incoming students. Fortunately for us, this is one of those subjects where Canada has decent public data on the subject, as the Canadian University Survey Consortium (CUSC) has been asking a (mostly) consistent set of questions to first-year students on a triennial basis since 2001. It’s not a perfect survey: consortium membership changes from cycle to cycle, so the base population is neither equal to the national first-year population (though this year they had 46 participating institutions, a record), nor is it perfectly stable from one survey to another. But since Statscan has abandoned all pretence of caring about youth and post-secondary education (no doubt all the better to concentrate on its core business of doing annual censuses of the country’s mushroom growers), this is the best we’ve got. In truth, it’s a pretty decent survey all things considered, and, for at least a few items, we have time series going back nearly two decades, which makes it an interesting way to look at long-term trends in the Canadian student body.
A quick data/methodology note before we start. The survey is not of this year’s (2019-20) first-year students, but of those starting university in September 2018 (survey was taken in February-March). The survey is heavily weighted towards the country’s smaller institutions: only five of the U-15 and none of the “Big Five” participated this year, which is a bit of a change from earlier iterations, so keep that in mind when comparing results over time.
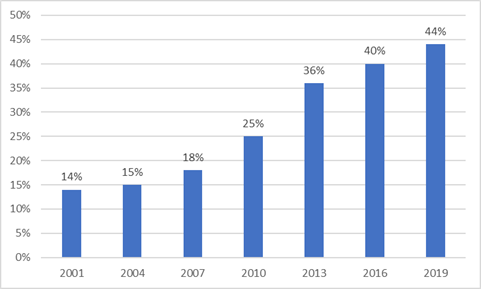
Let’s start with the result I find most fascinating: that is, students’ ethnic origin. 44% of last year’s incoming class described themselves as being a “visible minority”, which is more than triple the number who did in 2001. Even if we exclude all those who say they are international students (not all of whom are visible minorities), the figure is still 35%, and still a major change in composition over time. Partly, this reflects the country’s changing ethnic composition, Take, for example, the 2016 Census, which tells us that only 27% of Canadians aged 15-24 considered themselves a visible minority. However, somewhere between 35 to 45% of domestic (read Canadian) university students make that same claim. This suggests an overrepresentation of between 30 to 60%. Very few other countries can say anything similar; normally, minority populations are much less likely to attend university than the mainstream. Indeed, this is one of those factors that makes Canadian universities so different from those in the United States.
Figure 1: Percentage of First-year University Students Self-Identifying as a Visible Minority, 2001-2019

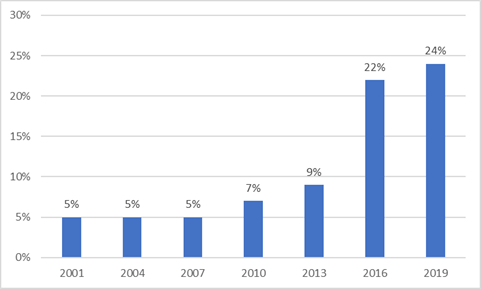
Another big an important shift is in the proportion of students who claim to have a disability/impairment. Between 2001 and 2013 this figure crept up from 5 to 9% – whether because more students with disabilities were accessing education or because of a reduced stigma in disclosing disabilities (or both) is hard to say. In 2016, the wording of this question changed to explicitly include mental health issues, and the proportion shot up to 22% before rising again to 24% this year. More than half of students indicated that they had a mental health issue.
Figure 2: Percentage of First-year University Students Self-Identifying as Having a Disability/Impairment, 2001-2019

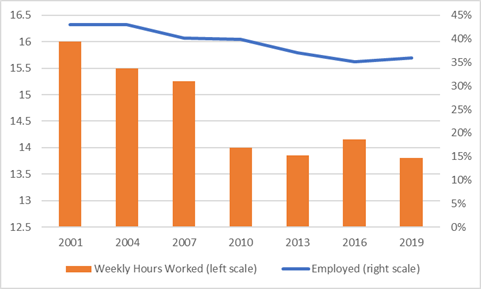
Finally, there is the issue of work. Many people think that students today are more likely to work while studying than in the past. This is probably true if we are looking at time horizons of 40 or 50 years; but over 20 years it doesn’t seem to be the case at all. In fact, what repeated surveys of first-year students find is a gradual, long-term drop in the proportion of students employed and in the average hours worked by those who do work. This may have to do with the long-term improvement of student aid in Canada; it will be interesting to see in 2022 if recent backsliding on student aid in Ontario (which accounts for over 40% of all university students in the country) moves these numbers at all.
Figure 3: Percentage of First-year University Students Employed and Average Weekly Hours Worked, 2001-2019

There are a whole bunch of other fascinating findings in the survey which I am sure will be of interest to many of you: copies of this and previous years’ surveys are all available here. I encourage you to read them. And thanks again to the CUSC folks who keep pumping these surveys out year after year: your work keeps us all informed about the state of the student body, even when our national statistics agency (and, apparently most of the country’s research-intensive universities) don’t seem to give a toss.
Interested in more figures and information like this? Check out HESA’s State of Postsecondary Education in Canada, 2019

 Tweet this post
