Today is a statistical overview for International Women’s Day.
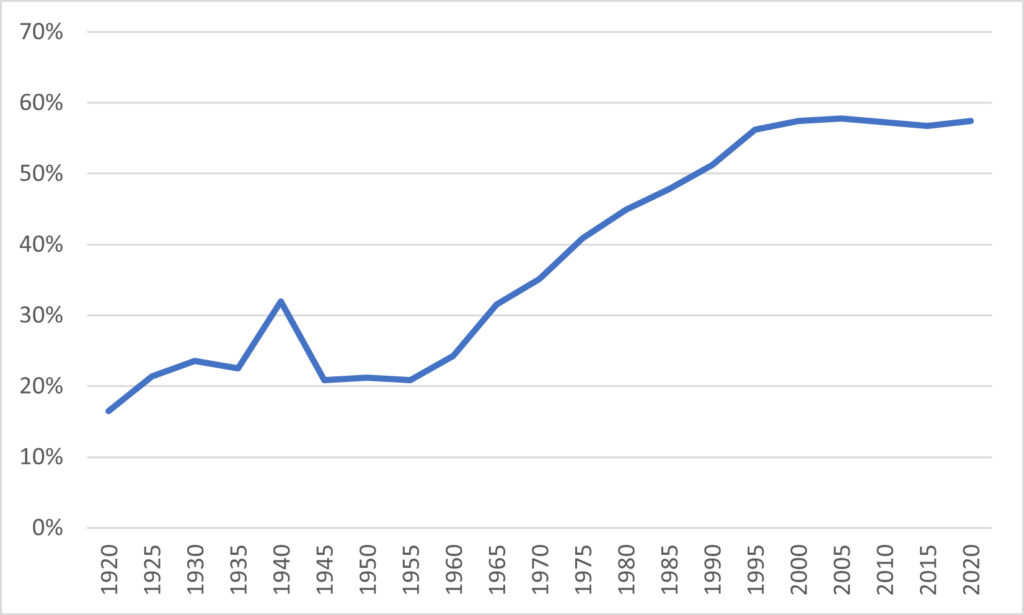
Let’s start by looking at student numbers. Figure 1 gives us the long view on female participation in universities (sorry college folks: Statscan data for your sector is a mess prior to the 1990s). Women represented about 20% of university students from the 1920s to the mid-1950s, apart from the years during World War 2. Starting around 1955, women’s share of total enrolments began a steady climb. By 1989, women passed the 50% mark, and their share of enrolments continued increasing for another decade until it reached 58% around the year 2000. Women’s share of total enrolments has been stable since then.
Figure 1: Women’s Share of Total University Enrolments, 1920-2020
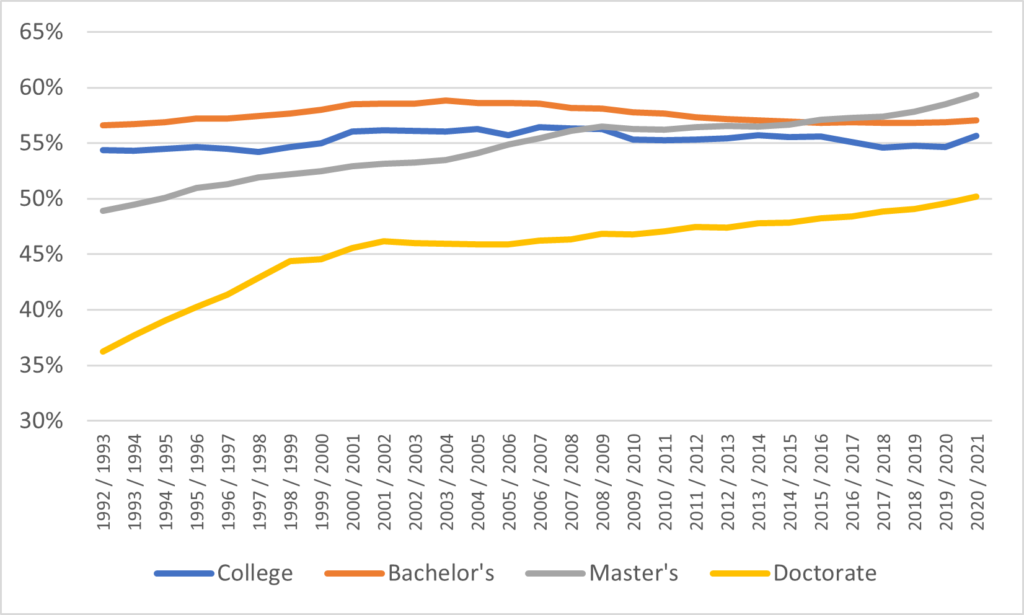
We can look at this pattern in more detail in the years after 1992. Since the early 1990s, women’s share of total enrolments at the undergraduate and college levels have remained relatively constant, at around 57-58% and 55%, respectively. At the master’s level, enrolment share rose from just under 50% in the early 1990s, to just under 60% today. Women’s share of enrolments at the doctoral level rose quickly in the 1990s, rising from 35% to 45%. Growth slowed thereafter but was still strong enough to exceed 50% for the first time in 2020-21.
Figure 2: Women’s Share of Post-Secondary Enrolments, by level, 1992-93 to 2020-21
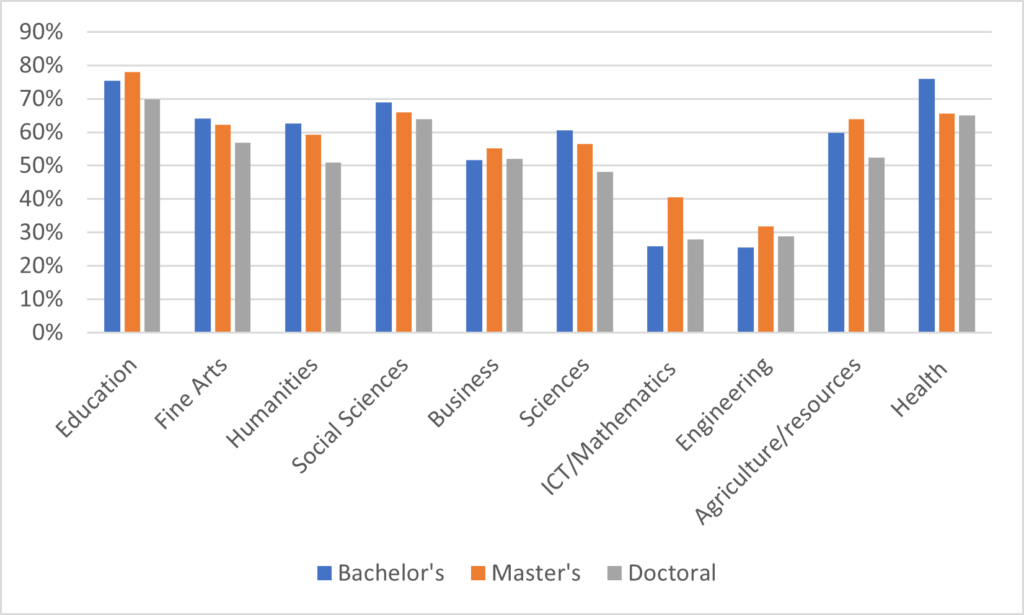
We can also look at women’s share of enrolments by field of study. Figure 3 shows this varies quite substantially: women really predominate in health, education and social sciences, while in computer science/mathematics and engineering women remain a long way from parity. Note that in the areas where women have the highest share of undergraduate enrolments, their share is lower at the graduate level; conversely, in those areas where undergraduate participation is weakest, women’s shares of enrolment at the graduate level is somewhat higher.
Women’s shares of enrolment at the undergraduate level internationally demonstrates a lot less variation than before. Ten years ago, there were still some parts of the OECD where women’s share was below 50%, but this is not longer true: in all major countries, women’s share is now over 50%,
Figure 4: Women’s Share of Undergraduate Enrolment, Selected OECD Countries, 2018
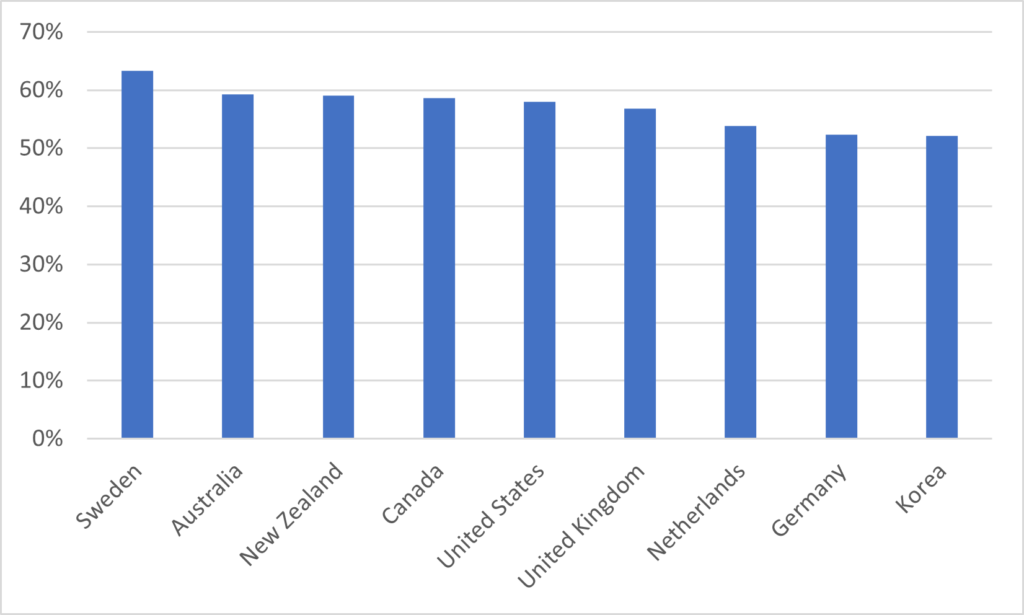
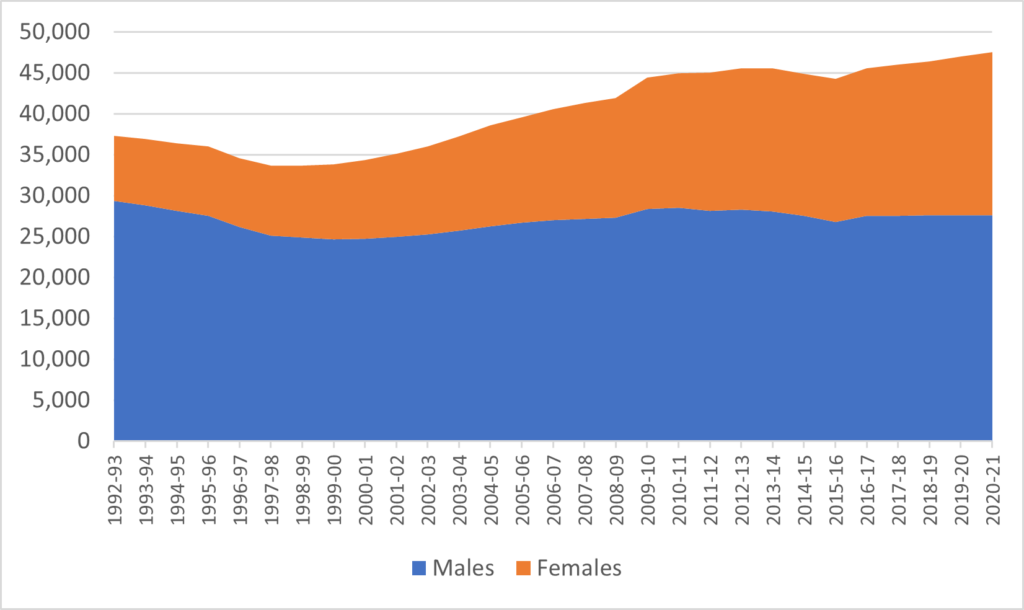
Figure 5 shows the number of tenured and tenure-track academic staff in Canada, from 1992-93 to 2020-21. The current sex ratio among this group is 58% men and 42% women: however, growth in the number of women professors has been slightly larger that the growth in faculty number overall; the number of male professors is still roughly where it was in 1995 while the number of women has more than doubled.
Figure 5: Total Tenured and Tenure-track Academic Staff Numbers by Sex, Canada, 1992-93 to 2020-21
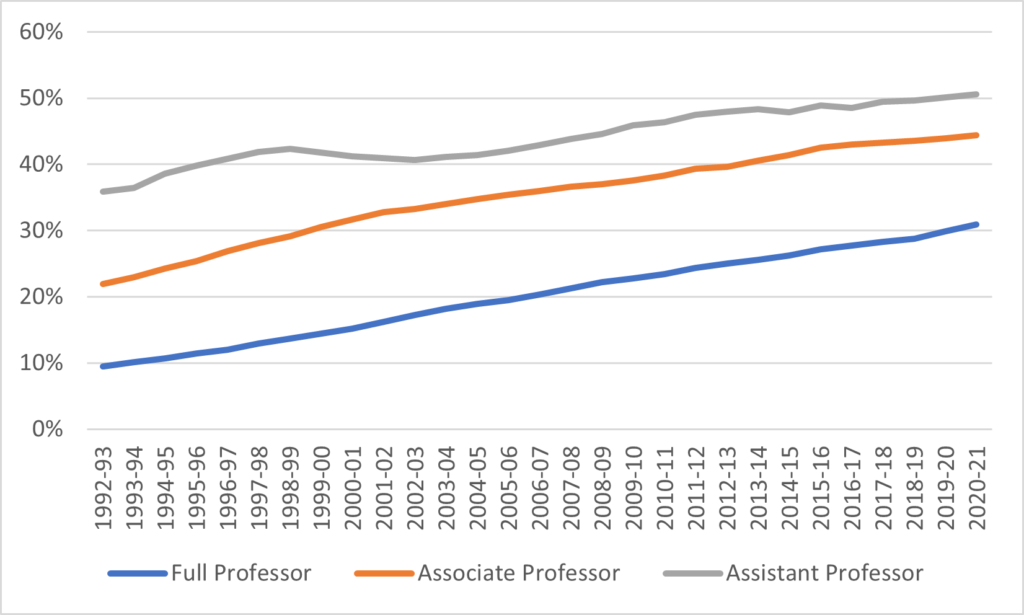
As you might expect, the picture in the professoriate looks a little bit different when you break the data out by seniority. Just over 50% of assistant professors are women (judging by the data, I’d say we hit overall gender parity in new hires around 2017). However, as you climb the seniority levels, you see fewer women, because these numbers largely (but not entirely) reflect hiring patterns of around ten years ago in the case of associate professors and maybe twenty years ago for full professors. At current rates, women professors will probably hit parity at the associate professor level in ten to twelve years; at the full professor level, the straight-line projection suggests equality around 2050, which is ludicrous if you stop to think about it.
Figure 6: Women’s Share of Ranked Academic Staff Positions, by Rank, Canada, 1992-93 to 2020-21
In short: lots of progress made but still much to do.

 Tweet this post
