One of the things that keeps popping up in labour relations is the salary comparison: a union at one institution says, “we deserve what professors at the University of X get”. It’s a reasonable tactic, but making useful and accurate comparisons at the institutional level is much harder than it looks, and one needs to be alert to the possibility of cherry-picking comparisons.
Academic salaries in Canada are, for the most part, based on three things: rank, years of service, and field of study. The greater the proportion of staff with full professorships, the older the average faculty age; and, the more professional programs a school has, the higher faculty salaries will be. The last is especially pernicious: comparing the averages at, say, Winnipeg and Manitoba will lead to all sorts of the distortion, due to the presence of Law, Medicine, Dentistry, and Engineering at the latter. My advice: ignore anyone who tries to sell you something based on those types of comparisons.
But even within institutions of similar size and scope, there’s still plenty of potential for bad comparisons. Take, for example, this close comparator set of institutions from the Maritimes: St. Thomas University (STU), Mount Allison University (Mt.A), St. Francis Xavier University (St. FX), Mount St. Vincent University (MSV), and Acadia University.
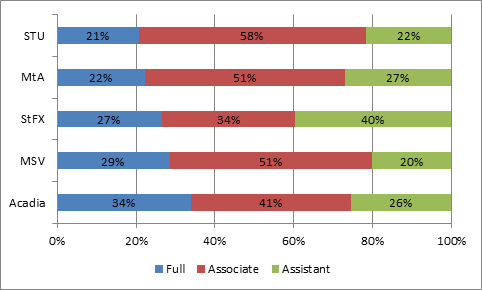
Figure 1 – Distribution of Faculty by Rank, Selected Small Maritime Institutions, 2009-10
As Figure 1 shows, these institutions have quite different rank structures. St. FX has a lot more junior faculty than the others, with 40% of the staff being at the assistant level; At MSV and STU, the proportion of assistant professors is half that of St. FX. Given the salary gap between full and assistant professors, this has a non-trivial effect on the overall average salaries; if St. FX had MSV’s rank structure, its average salary would rise by about 6%.
To get closer to an apples-to-apples comparison, one needs to look at the actual average salaries by rank, as in Figure 2.
Figure 2 – Salaries by Rank, Selected Small Maritime Institutions, 2009-10
According to this data (and yes, it’s a little old, but this is a free email, and you get what you pay for), St. FX has the lowest salaries across the board, while Mt.A has (mostly) the highest.
But even this might not be an entirely accurate comparison. If the average years-since-promotion at one institution is higher than at another, even the comparisons within each salary band may be off a bit, because of the effects of rising through the ranks (worth 2-3% per average year of difference, at the moment). That’s probably not enough to explain the entire gap between St. FX and the others, but it may explain some of it.
Finally, of course, all of these comparisons are suspect, without comparing work loads. But that’s another story, all together.


 Tweet this post

One response to “How to Compare Salaries”