

Just a quick one today, mostly charts.
Back in the fall, StatsCan released a mess of data from the Labour Force Survey looking at education participation rates—that is, the percentage of any given age cohort that is attending education—over the past 25 years. So, let’s go see what it says.
Figure 1 shows total education participation rates, across all levels of education, from age 15 to 29, for selected years over the past quarter century. At the two ends of the graph, the numbers look pretty similar. At age 15, we’ve always had 95%+ of our population enrolled in school (almost exclusively secondary education, and from age 26 and above, we’ve always been in the low-tweens or high single digits. The falling-off in participation is fairly steady: for every age-year above 17, about 10% of the population exits education up until the age of 26. The big increase in education enrolments that we’ve seen over the past couple of decades has really occurred in the 18-24 range, where participation rates (almost exclusively in universities, as we shall see) have increased enormously.
Figure 1: Participation rates in Education (all institutions) by Age, Canada, select years 1999-00 to 2023-24
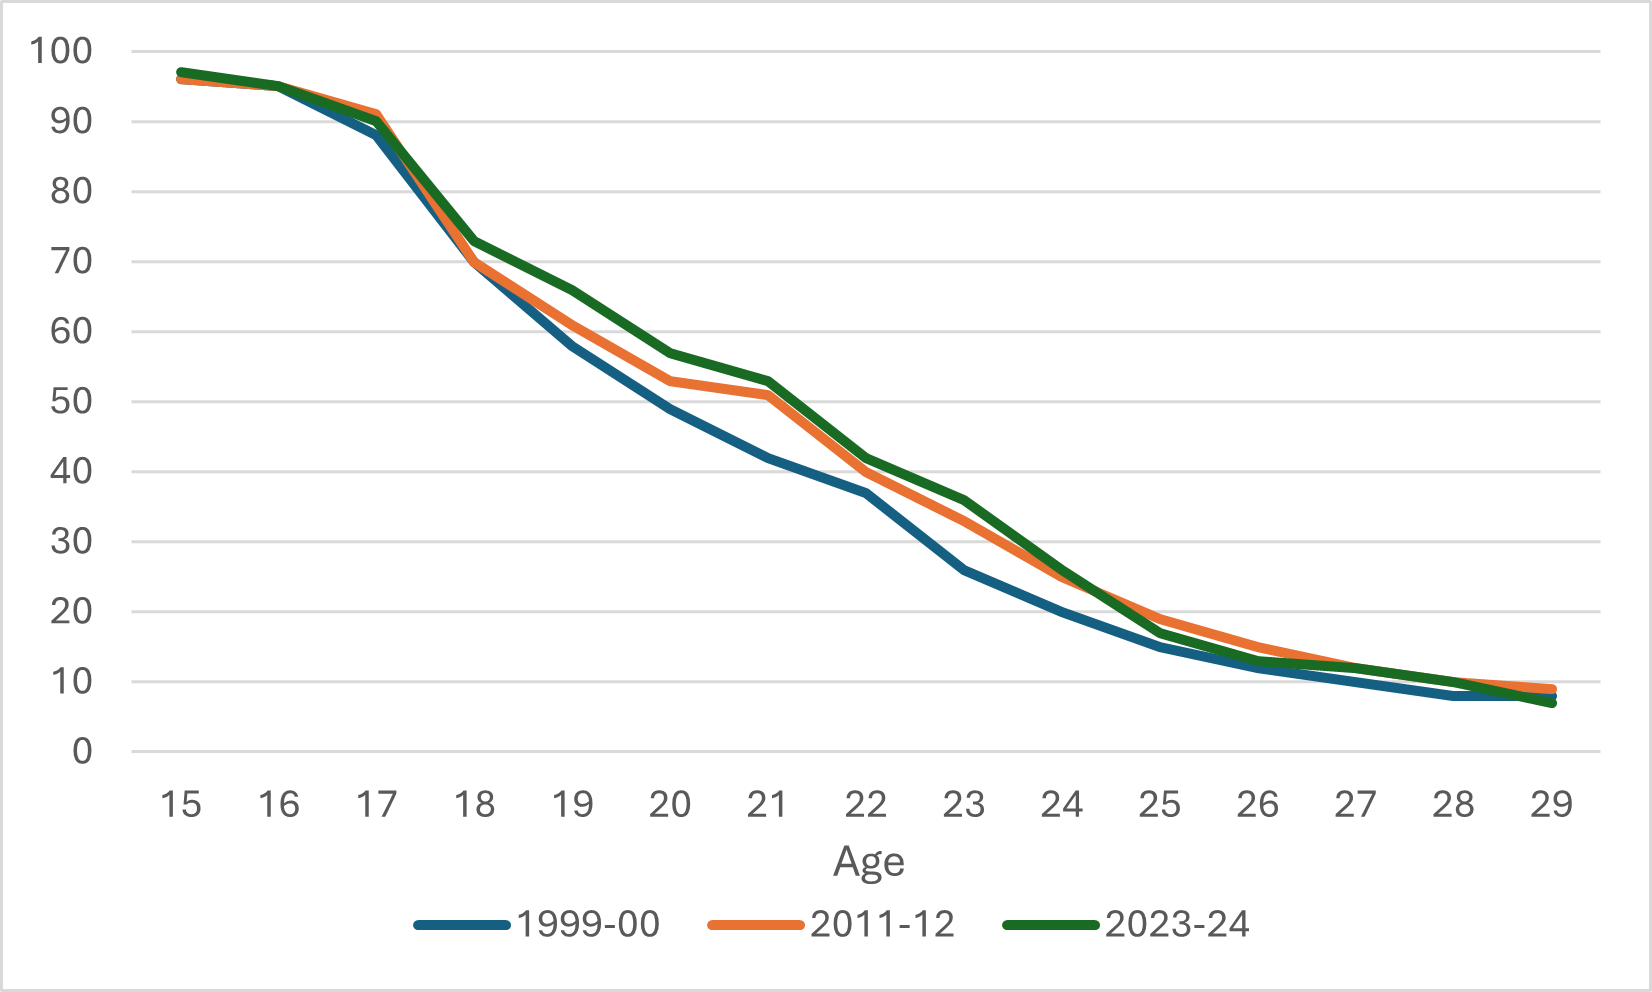
Figure 2 shows current participation rates by age and type of postsecondary institution. People sometimes have the impression that colleges cater to an “older” clientele, but in fact, at any given age under 30, Canadians are much more likely to be enrolled in universities than in colleges. Colleges have a very high base in the teens because of the way the CEGEP system works in Quebec (I’ll come back to regional diversity in a minute), and it is certainly true that there is a very wide gap in favour of universities among Canadians in their mid-20s. But while the part rate gap narrows substantially at about age 25, it is never the case that the college participation rate surpasses the university one.
Figure 2: Participation Rates by Age and Institution Type, Canada, 2023-24
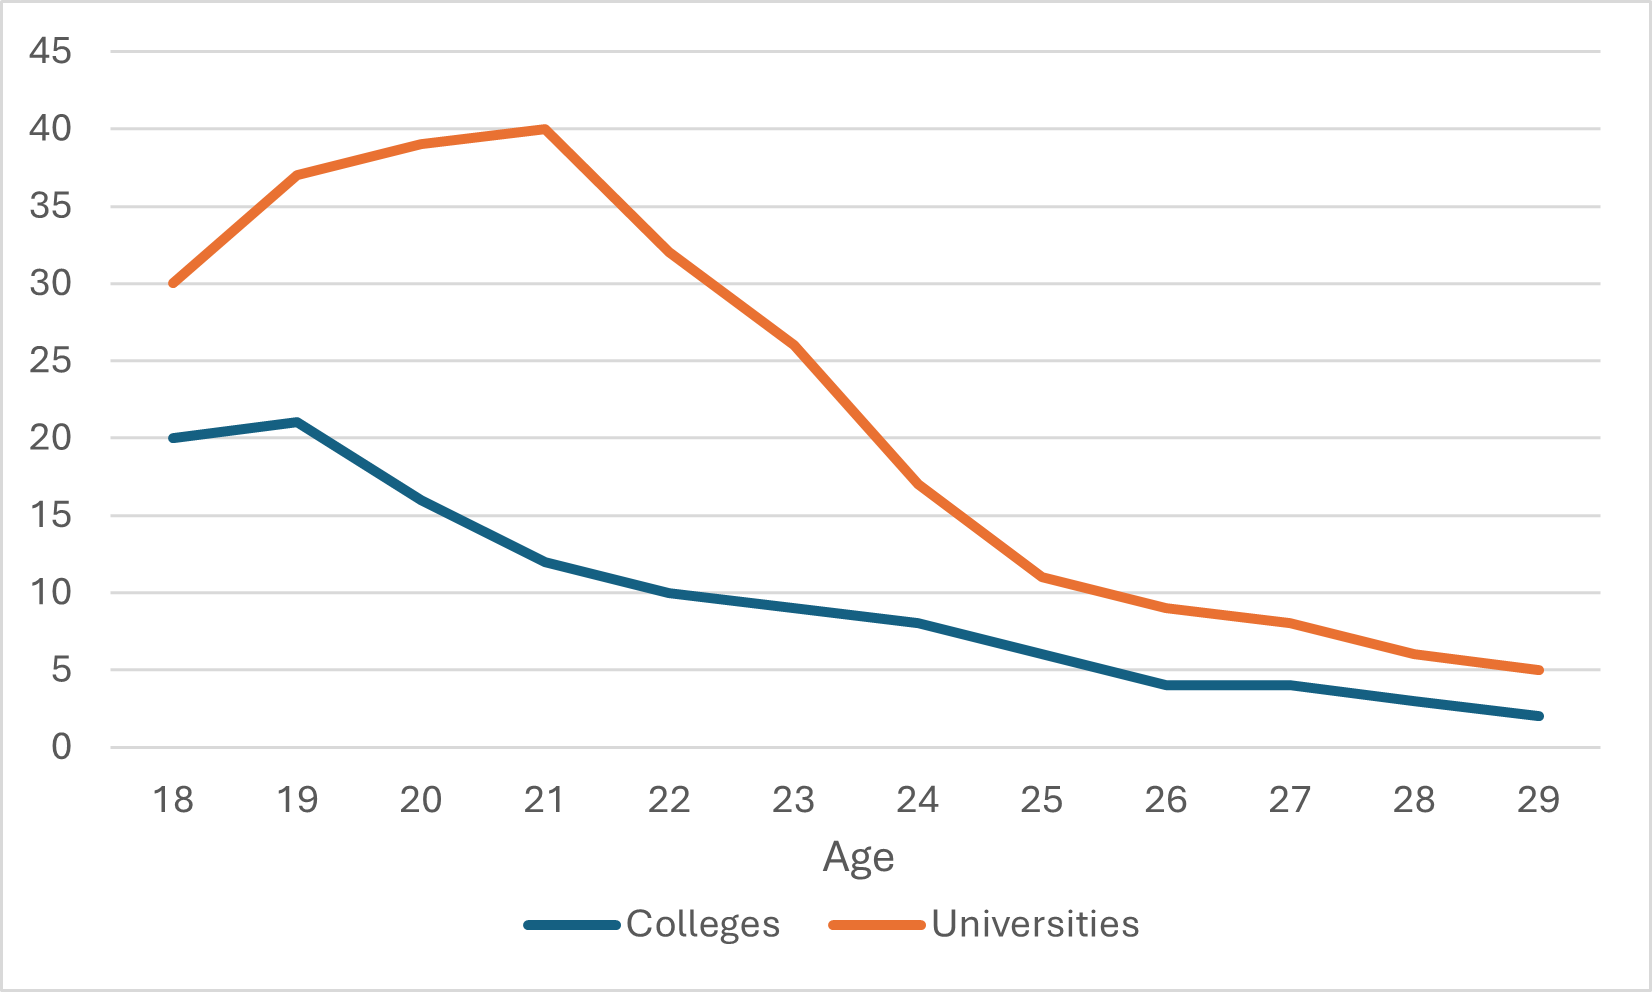
Figure 3 shows college participation rates by age over time. What you should take from this is that there has been a slight decline in college participation rates over time in the 19-23 age range, but beyond that not much has changed.
Figure 3: College Participation Rates by Age, Selected Years, 1999-2000 to 2023-24
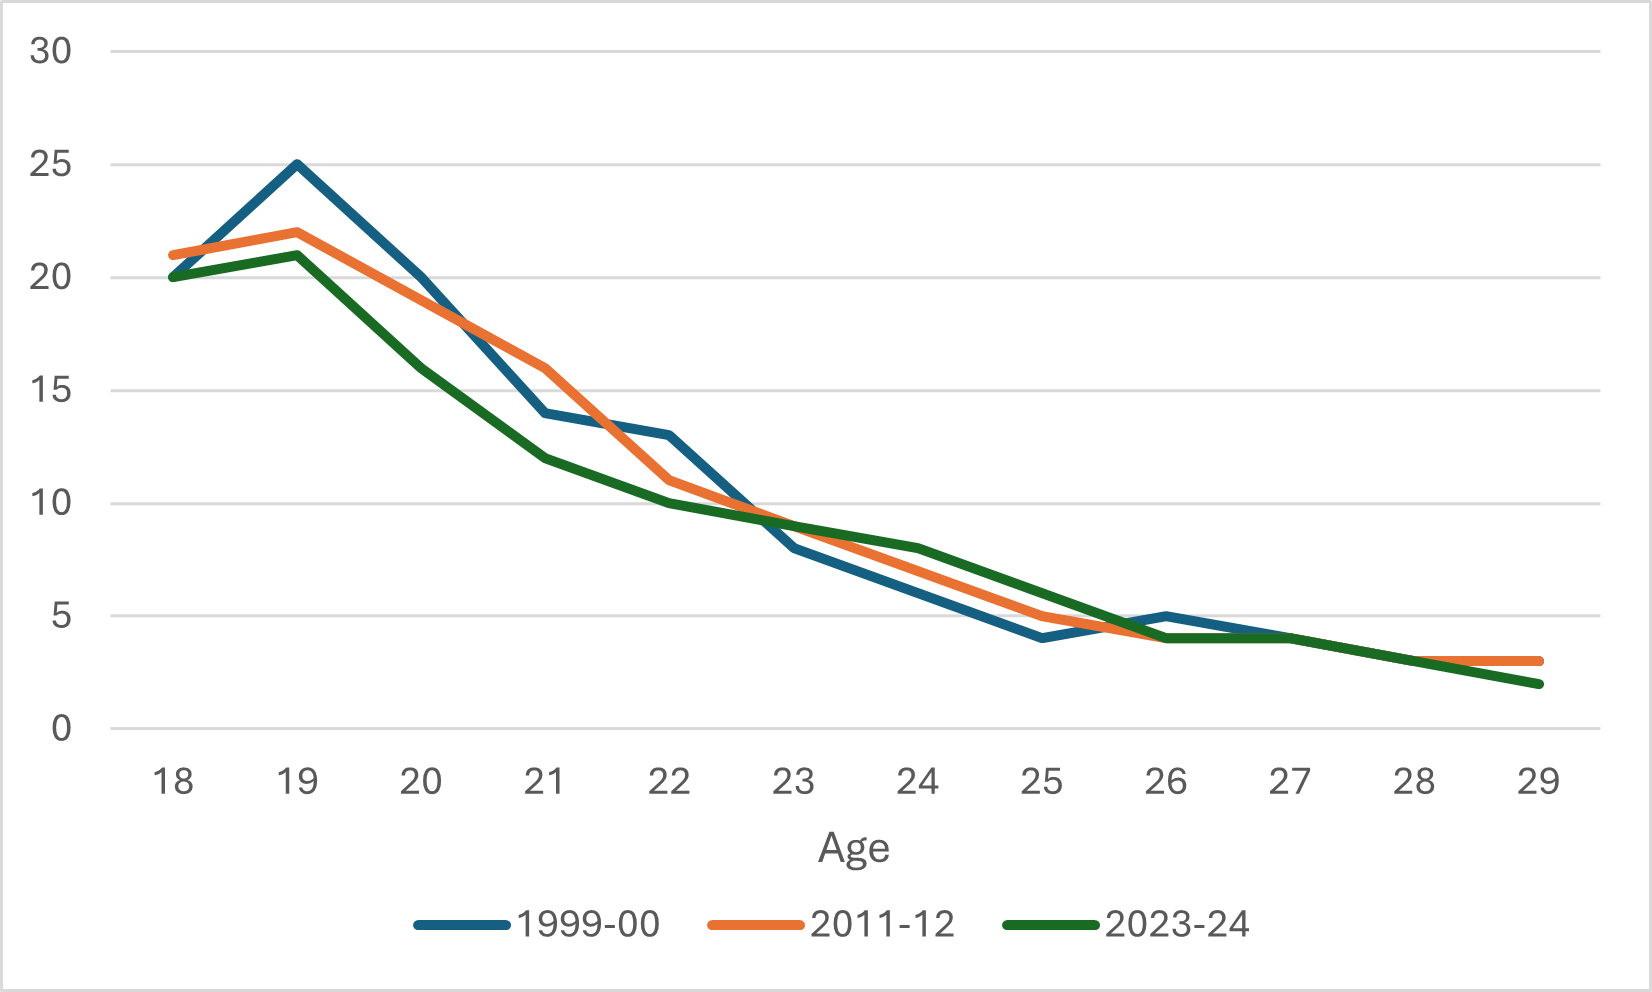
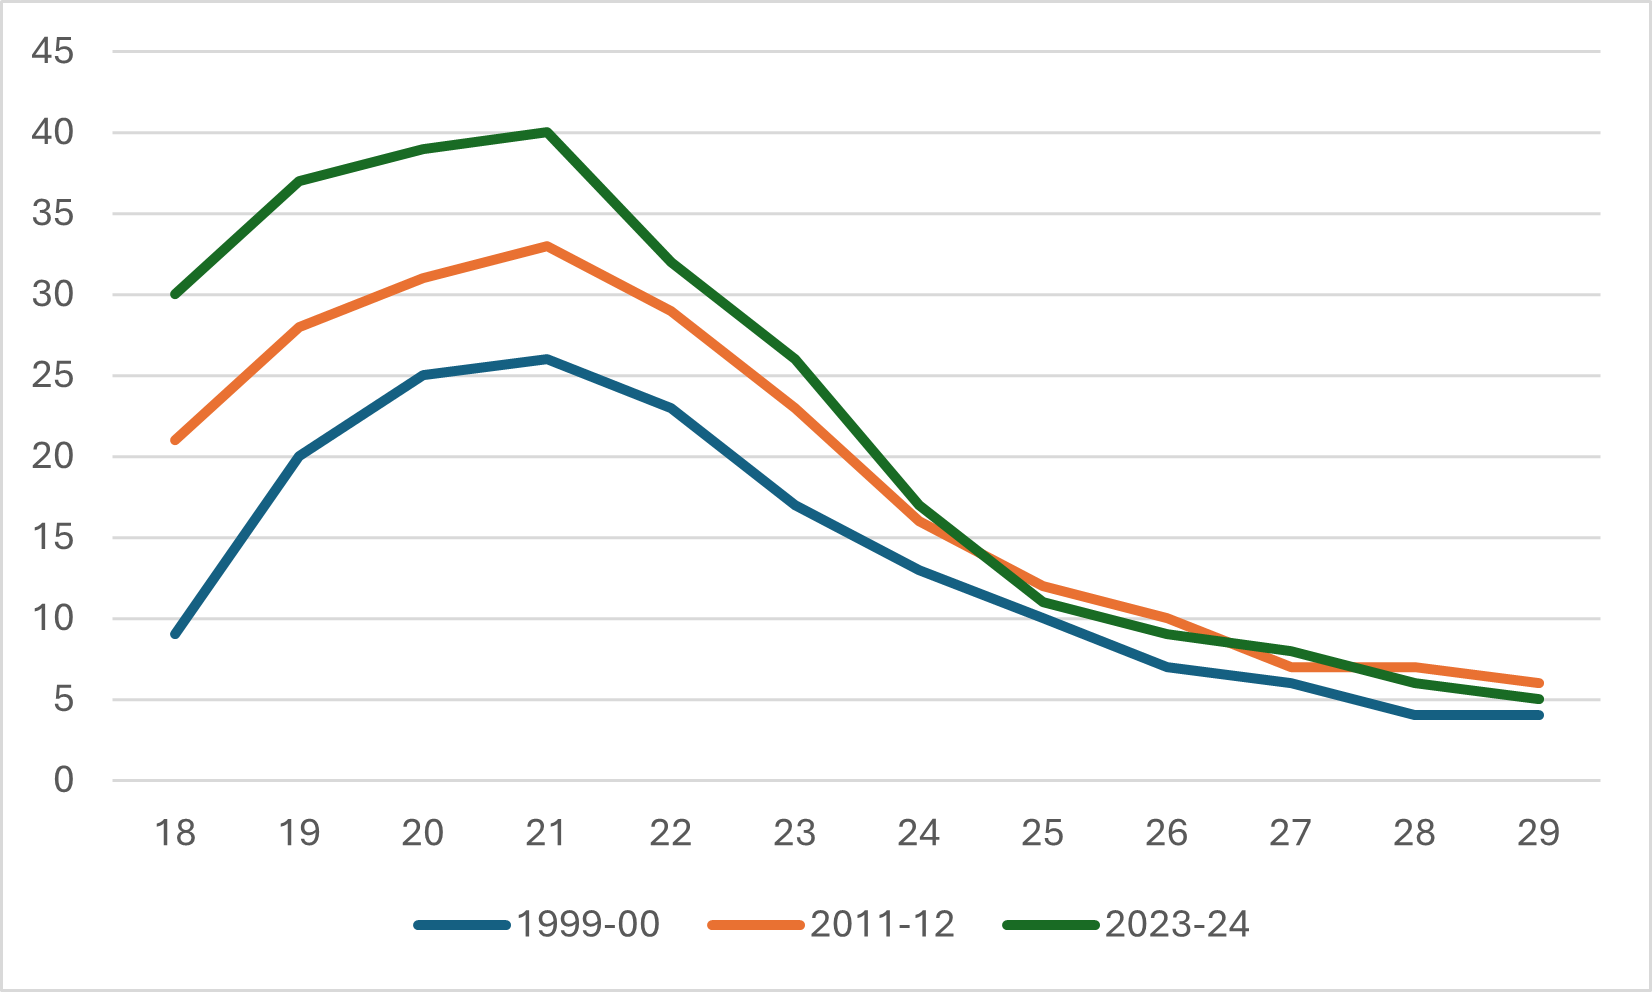
Figure 4 uses the same lens as figure 3 only for universities. And it’s about as different as it can be. In 1999, fewer than one in ten Canadians aged 18 was in university: now it is three in ten. In 1999, only one in four 21 year-olds was in university, now it is four-in-ten. These aren’t purely the effects of increased demand; the elimination of grade 13 in Ontario had a lot to do with the changes for 18-year-olds; Alberta and British Columbia converting a number of their institutions from colleges to universities in the late 00s probably juices these numbers a bit, too. But on the whole, what we’ve seen is a significant increase in the rate at which young people are choosing to attend universities between the ages of 18 and 24. However, beyond those ages the growth is less pronounced. There was certainly growth in older student participation rates between 1999-00 and 20011-12, but since then none at all.
Figure 4: University Participation Rates by Age, Selected Years, 1999-2000 to 2023-24
So much for the national numbers: what’s going on at the provincial level? Well, because this is the Labour Force Survey, which unlike administrative data has sample size issues, we can’t quite get the same level of granularity of information. We can’t look at individual ages, but we can see age-ranges, in this case ages 20-24. In figures 5 and 6 (I broke them up so they are a bit easier to read), I show how each province’s university and college participation rates in 2000 vs. 2023.
Figure 5: University Participation Rates for 20-24 Year-olds, Four Largest Provinces, 2000-01 vs. 2023-24
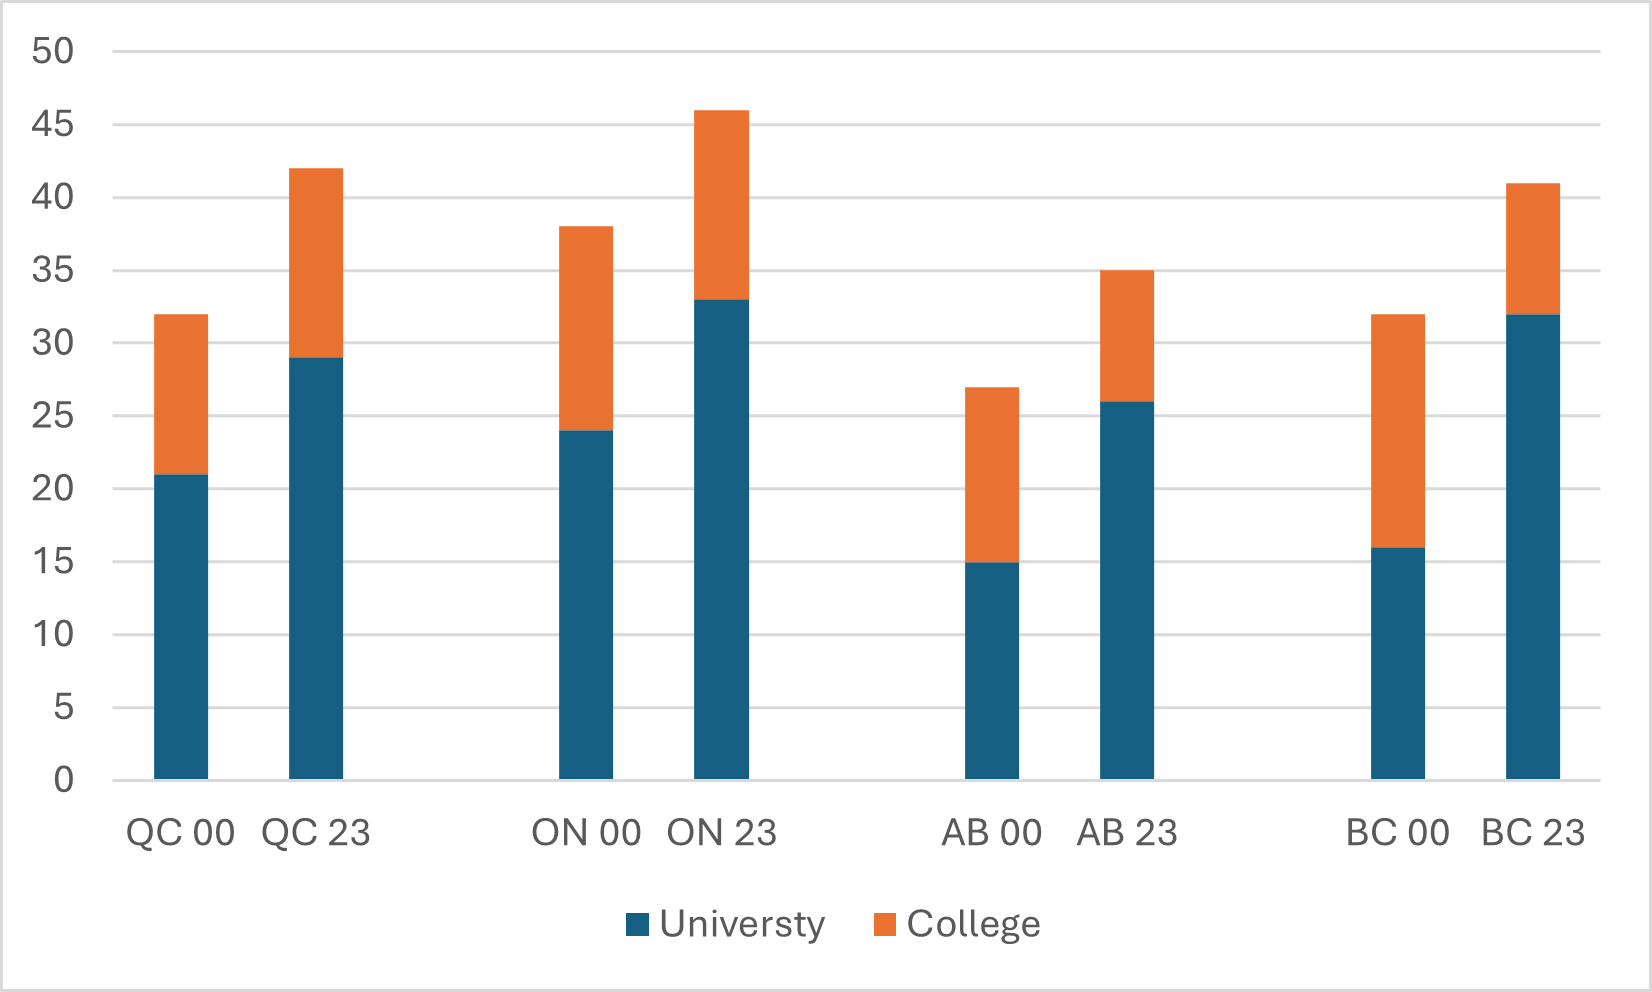
Figure 6: University Participation Rates for 20-24 Year-olds, Six Remaining Provinces, 2000-01 vs. 2023-24
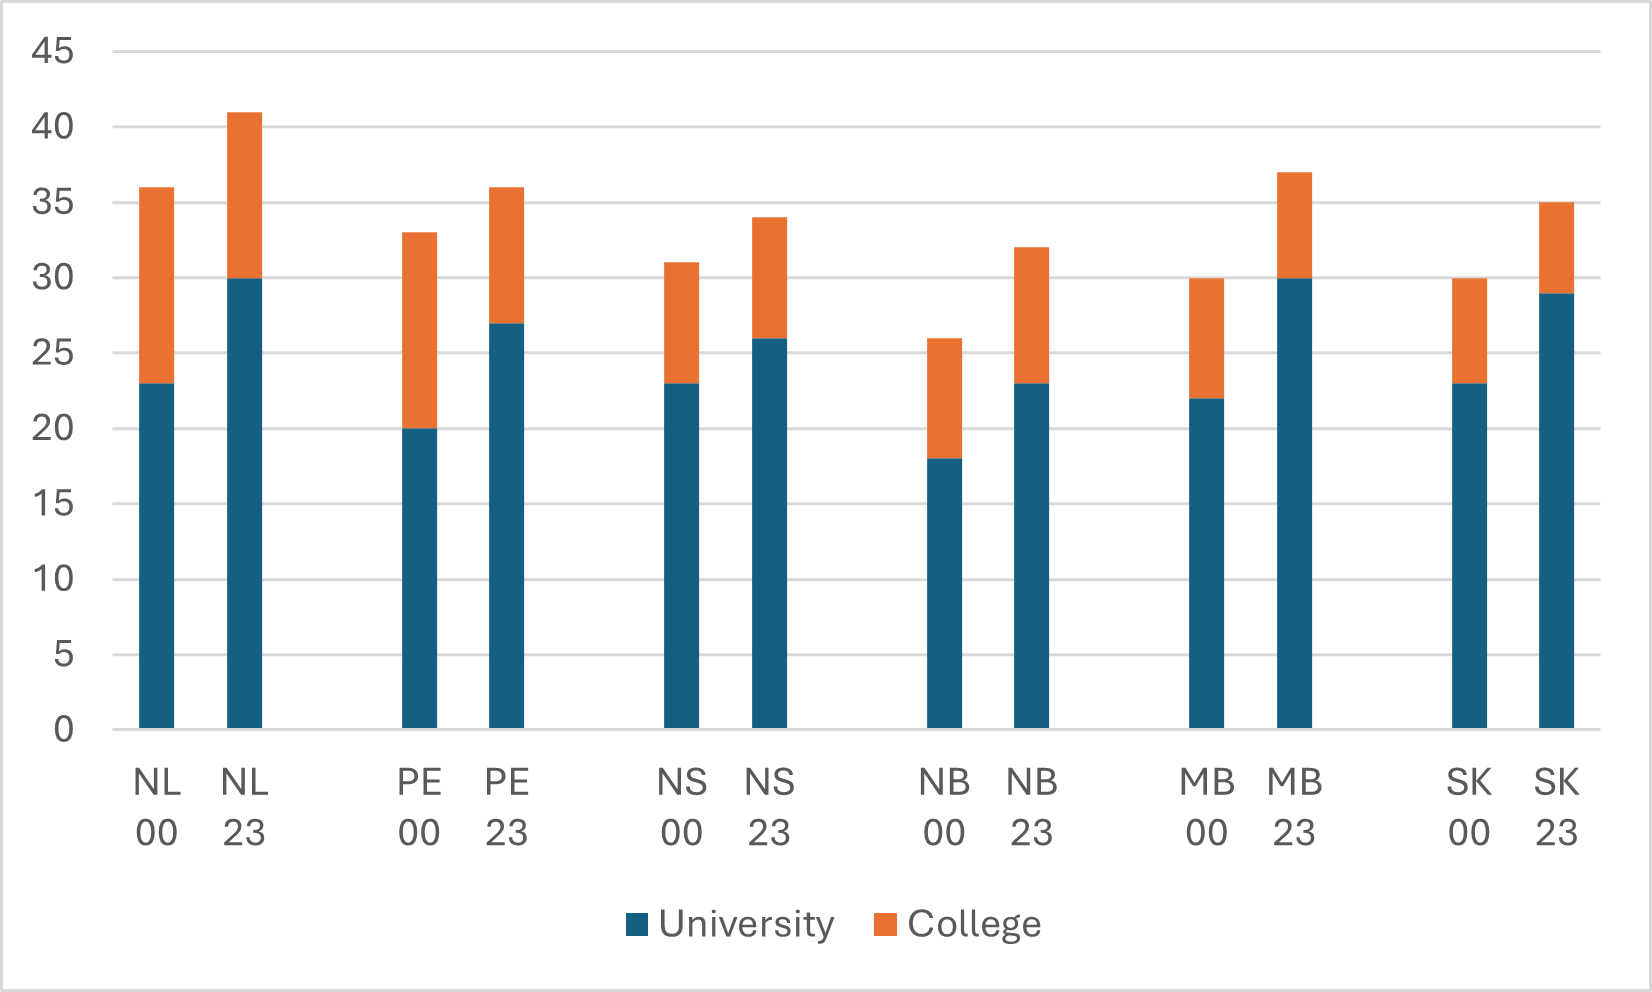
Some key facts emerge from these two graphs:
- The highest participation rates in the country are in Ontario, Quebec, and British Columbia.
- In all provinces, the participation rate in universities is higher than it is for colleges, ranging from 2.5x in Quebec for over 4x in Saskatchewan.
- Over the past quarter century, overall postsecondary participation rates and university participation rates have gone up in all provinces; Alberta and British Columbia alone have seen a decline in college participation rates, due to the aforementioned decision to convert certain colleges to university status in the 00s.
- Growth in participation rates since 2000 has been universal but has been more significant in the country’s four largest provinces, where the average gain has been nine percentage points, and the country’s six smaller provinces, where the gain has been just under five percent.
- Over twenty-five years, British Columbia has gone from ninth to second in the country in terms of university participation rates, while Nova Scotia has gone second to ninth.
- New Brunswick has consistently been in last place for overall participation rates for the entire century.
Just think: three minutes ago, you probably knew very little about participation rates in Canada by age and geography, now you know almost everything there is to know about participation rates in Canada by age and geography. Is this a great way to start your day or what?
 Tweet this post

does this look any different when gender is taken into account? if that data is available of course?