Is there any part of the university that has been more transformed over the past decade than libraries? One of the fascinating things about looking through old Canadian Association of Research Libraries (CARL) statistical reports is how many things weren’t counted, say ten years ago. Expenditures on databases? Not counted. Logins to databases? Searches or article requests? Nope, nope. Not that those things didn’t exist back then – they just weren’t central enough to university missions to be thought worth counting.
One thing which was counted back then (and is still counted today) is loans. And if you want to get a sense of how libraries have changed in the past decade or so, check out this graph of changes in initial loans between 2004-05 and 2014-15, by institution.
Figure 1: Change in Numbers of Initial Loans, Canadian Research University Libraries, 2004-5 to 2014-5
Nationally, initial loans are down 58% across 27 CARL universities over the past decade (Brock and Ryerson are not shown because they did not provide statistics in 2004-05), from 11 million per year to just 5 million per year. Simon Fraser has experienced the lowest drop – just 24%. At Concordia, the fall was 81%. And these figures do not account for growth in student numbers: add those in and figures would drop another 20% or so.
In other words, libraries are decreasingly about books but increasingly about electronic resources. And this has had impacts on employment. Across all 27 institutions, FTE employment is down 11%, with the biggest falls at some of the most research intensive universities: Alberta down 35%, McGill down 33%, Queen’s down 26%. Toronto bucked that trend with a fall of just 5%, and four institutions (Calgary, Carleton, SFU and Ottawa) actually saw increases in employment. But overall we are seeing a decline in numbers.
But, as with professorial staff (with whom they are often grouped in the same collective agreements), librarians have seen a considerable upward drift in pay. So while FTE employment is down, nationally, aggregate staff compensation is still up 3% in inflation-adjusted dollars (for comparison, aggregate professorial salaries are up about 39% over the same period). But here again the variation at the institutional level is absolutely enormous, from +50% at Regina, to -22% at McGill.
Figure 2: Change in Real Expenditures on Library Staffing, Canadian Research University Libraries, 2004-5 to 2014-5
So much for staffing: what about acquisitions (or, more broadly, materials)? Good news here, these grew by 9% between 2004-05 and 2014-15, though again, there’s really not that many institutions which are close to the national mean. Of particular interest here are the identities of the two institutions who saw the biggest increase in spending: namely, Memorial and Ottawa. Probably not coincidentally, these are the two institutions currently engaged in the biggest rows about cutting back on periodicals (see here and here).
Figure 3: Change in Real Expenditures on Library Materials, Canadian Research University Libraries, 2004-5 to 2014-5
These last two graphs raise the question: do institutions have consistent strategies with respect to allocating their budgets between staffing and acquisitions? Are both budgets being raised (or lowered) in tandem or are schools cutting in one so as to invest more in the other?
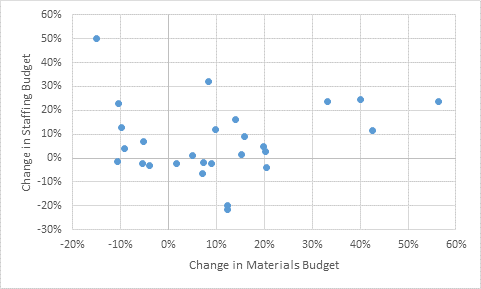
Figure 4: Change in Staffing Budgets v. Change in Materials Budget (in real dollars), Canadian University Research Libraries 2004-05 to 2014-15
Here’s the way to understand figure 4. In the upper left quadrant, you have institutions which are increasing their staffing budgets, but decreasing their materials budget (at the very top left is Regina, which is +50% and -15%). In the top right quadrant you see institutions which have increased both staffing and materials (the most notable example here is Ottawa, at +56% and +24%). Moving on clockwise to the bottom right, you see institutions which have cut staffing budgets and increased their materials budgets, and here you have both McGill and Alberta cutting the former by about 20% and increasing the latter by 12%. And finally, in the lower left quadrant, you have three institutions (Queen’s, Montreal and Windsor) which have seen real decreases in both staffing and materials.
Nationally, there seems to be very little correlation – positive or negative – between changes in one kind of spending and change in the other. To the extent that library expenditures are strategic, institutions seem to be pursuing a wide variety of strategies in this area. It would be interesting to correlate this data with user satisfaction surveys to see if any of them are more likelier than others to produce satisfactory outcomes.


 Tweet this post

Lack of physical books to reshelve leads to lack of part-time simple jobs for students in sorting and re-shelving them..
This used to be one of the few jobs for 50 to 100 students who were near or on campus. There are few jobs at Unis for most of them.
Now with Unis buying $200,000 sorting machines as part of checking books (and the occasional beer bottle, pizza box), there are fewer simple jobs on campus to work for.
Many unis are in small towns with few openings otherwise.
More things as journals and books online is useful for the mindless cut-and-paste that many students do now, and forgo older references available only by a trek to the library to look at and scan/photocopy.