


For many years, I have been making the point that Canada has very little good data on employment in the higher education sector. We have a national annual tally, based on administrative data, of ranked academic faculty in universities from a system called UCASS, or the University and College Academic Staff Survey (don’t let the title fool you, it’s really only universities). Beyond that—data on non-academic staff, or any national data at all on colleges—is basically bupkis.
Except, that’s not quite right. There are two surveys overing (in theory) the entire working population: the Survey of Employment Payroll and Hours (SEPH) and the Labour Force Survey (LFS), from which information about workers at universities and colleges can be gleaned. The problem is that because these instruments are surveys of employers and workers, respectively, and the percentage of the labour force working in postsecondary education is so small, both are liable to have significant margins of error. Which is another way of saying that this data is pretty choppy. A second problem is that the two surveys divide the world of employment up quite differently, making them difficult to use for the purpose of data triangulation.
Here’s a relatively simple example, comparing UCASS data on ranked academics vs. LFS data on full-time, salaried individuals who consider teaching at a university to be their primary source of employment. These two definitions are obviously not quite identical: for instance, there are some ranked profs who only work part-time, but it’s a relatively small number. We might expect these two sources—three if you count UCASS to have different exact numbers—but at least you’d think the tends in the broad numbers are largely identical, But nooooooo. It’s not just that one set of data is choppy and the other smooth, or that they are working from slightly different interpretations of what makes an academic—it’s that one of them is showing a significant increase in the number of academics and the other is not.
Figure 1: Estimates of Full-time University Academics (UCASS vs. LFS), in Thousands, 1997-2023
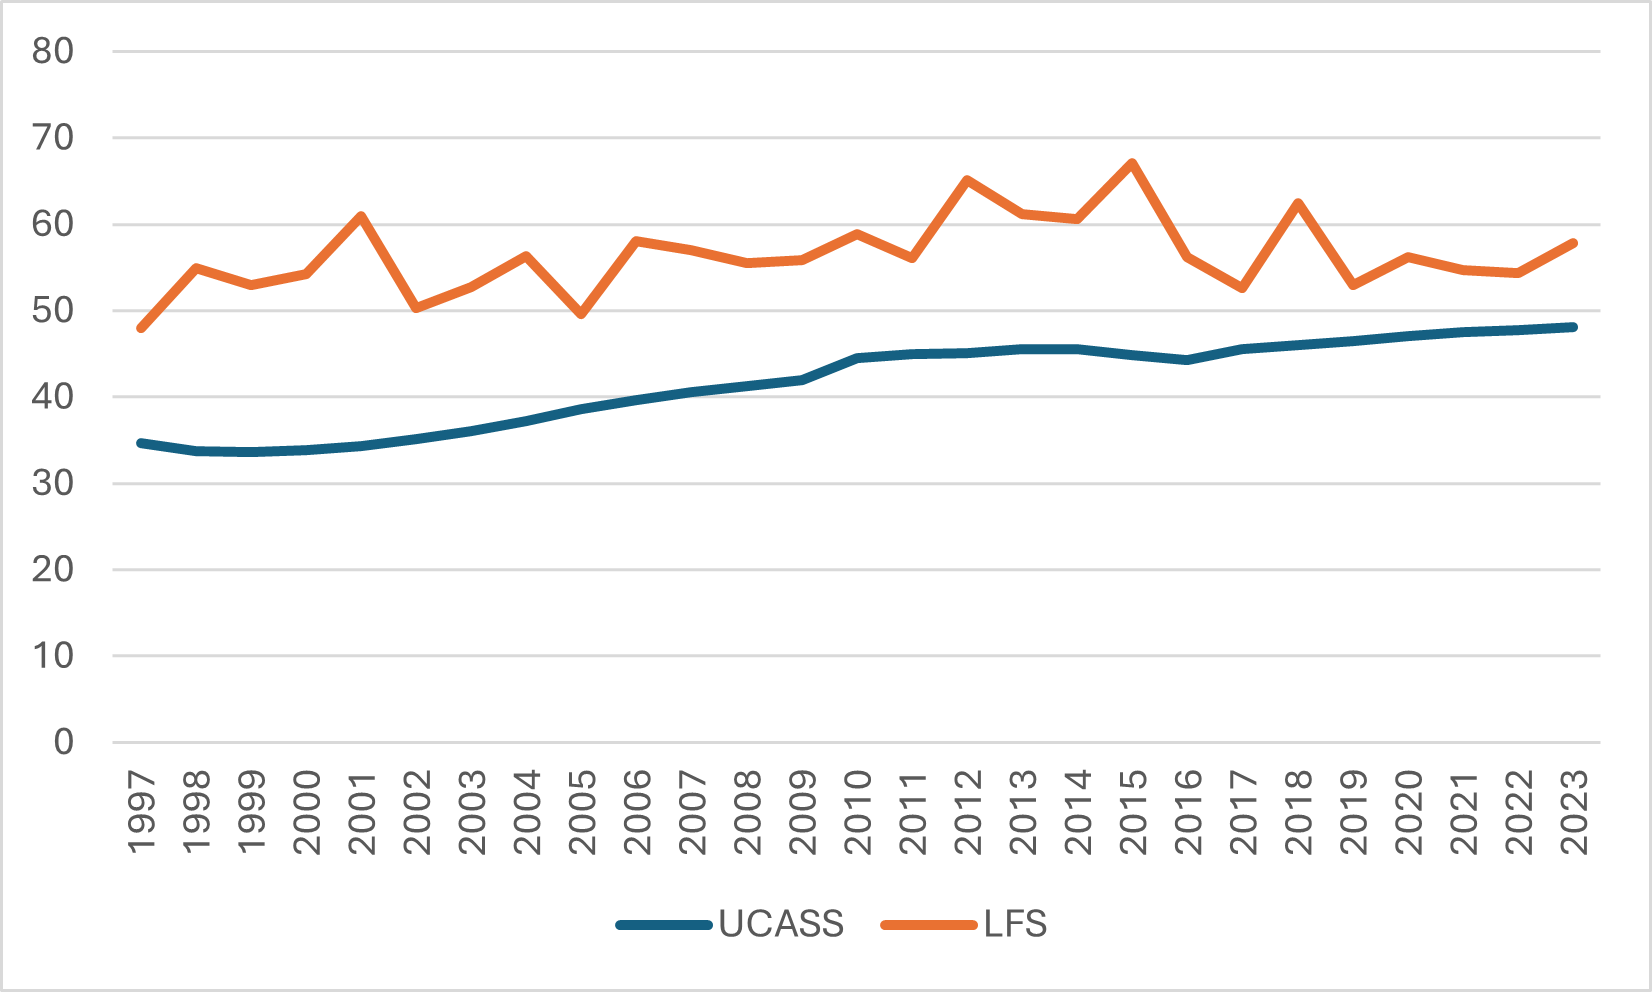
(There is of course a way both sources in Figure 1 can be right, but it implies that having full-time teaching staff outside of academic ranks was a big thing in in the 90s but has become a lot less prevalent since then, neither of which is true as far as I know).
Now let’s look at data from the SEPH. This survey does not care about things like occupations; what it cares about are total payroll and types of employees (salaried vs. hourly). As a result, we can’t look to it for answers to questions like “how many sessional lecturers are there” or “how many permanent non-academic staff are there” —the survey is blind to these things. What it can do, however, is tell us how big overall payrolls are and how much of payroll is salaried. Very large institutions fill this survey out every month, but smaller ones do not (I am not 100% sure where the boundary is); the data for the smaller ones only come into the survey every once in a while via sampling. This leads to outputs that are somewhat choppy as different institutions cycle in an out of the survey. But if you don’t get too hung up on month-to-month changes and focus just on the big picture, it’s still quite useful.
Figure 2 shows total university employment. Total university payrolls in Canada in 2022 were roughly 310,000, which is very close to 2% of the entire labour force. Between 55 and 62% of total university payrolls are made up of hourly workers. That may sound like a lot, but when you include all the student labour that universities hire it’s actually not all that surprising. Total employment has risen by 76% since the turn of the century, which is slightly faster than the growth in total student numbers (roughly 60%); the rate of growth has been somewhat greater on the permanent side (87%) than on the hourly side (69%).
Figure 2: Total Employment at Canadian Universities, by Type of Employee, 2001-2022
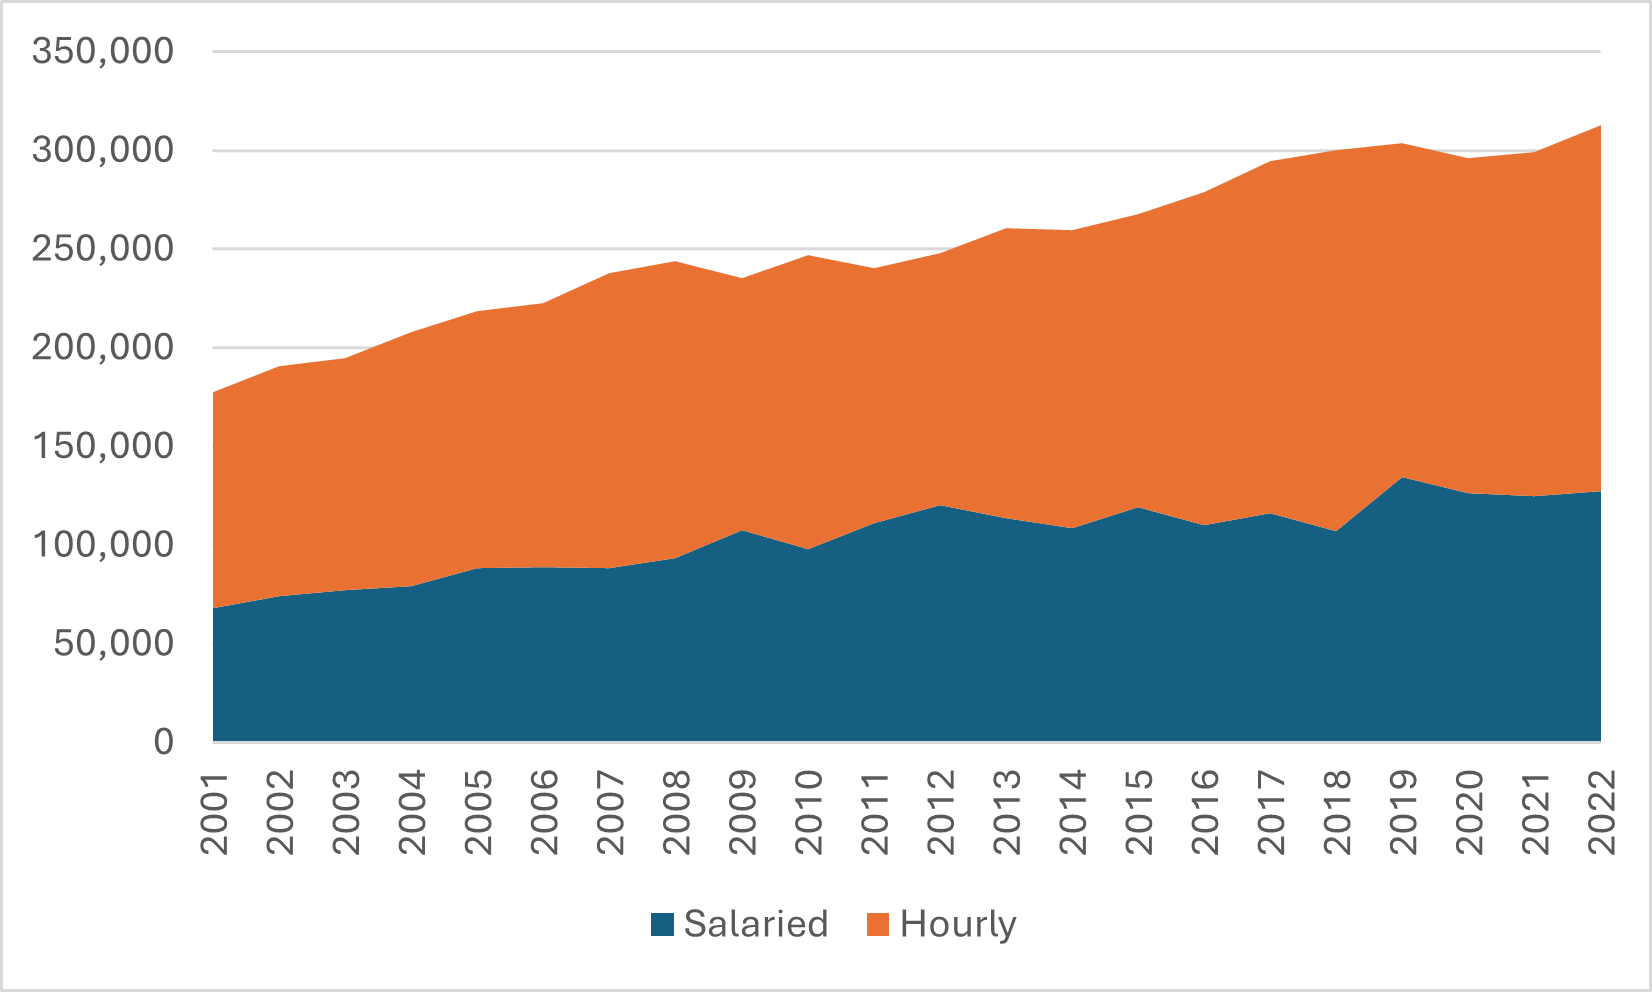
Now, in theory, we could work out how many non-academic staff (permanent ones anyway) are employed by universities by taking the “salaried” employers and subtracting the number of academic staff. The problem of course is that as shown in Figure 1, there are two very different figures out there for academic staff. If we use the LFS number of just under 60,000 full-time academics, then that would imply that non-academic staff numbers are in the 65-70,000 range. If we use the UCASS number of about 48,000 academics, then that would imply that non-academic staff numbers are closer to 80,000. My gut says the latter number is probably closer to the truth, but it is nevertheless worth acknowledging that there is some room for doubt and error here.
Now let’s do the college side. Figure 3 shows hourly and salaried employees for Canadian community colleges. This, apparently, is a much smaller workforce (total just over 120,000), and one which has been growing less quickly than universities over the last couple of decades (which is consistent with the pattern of enrolment growth). The hourly vs. salaried workforce is also similar to that seen in universities.
Figure 3: Total Employment at Canadian Colleges , by Type of Employee, 2001-2022
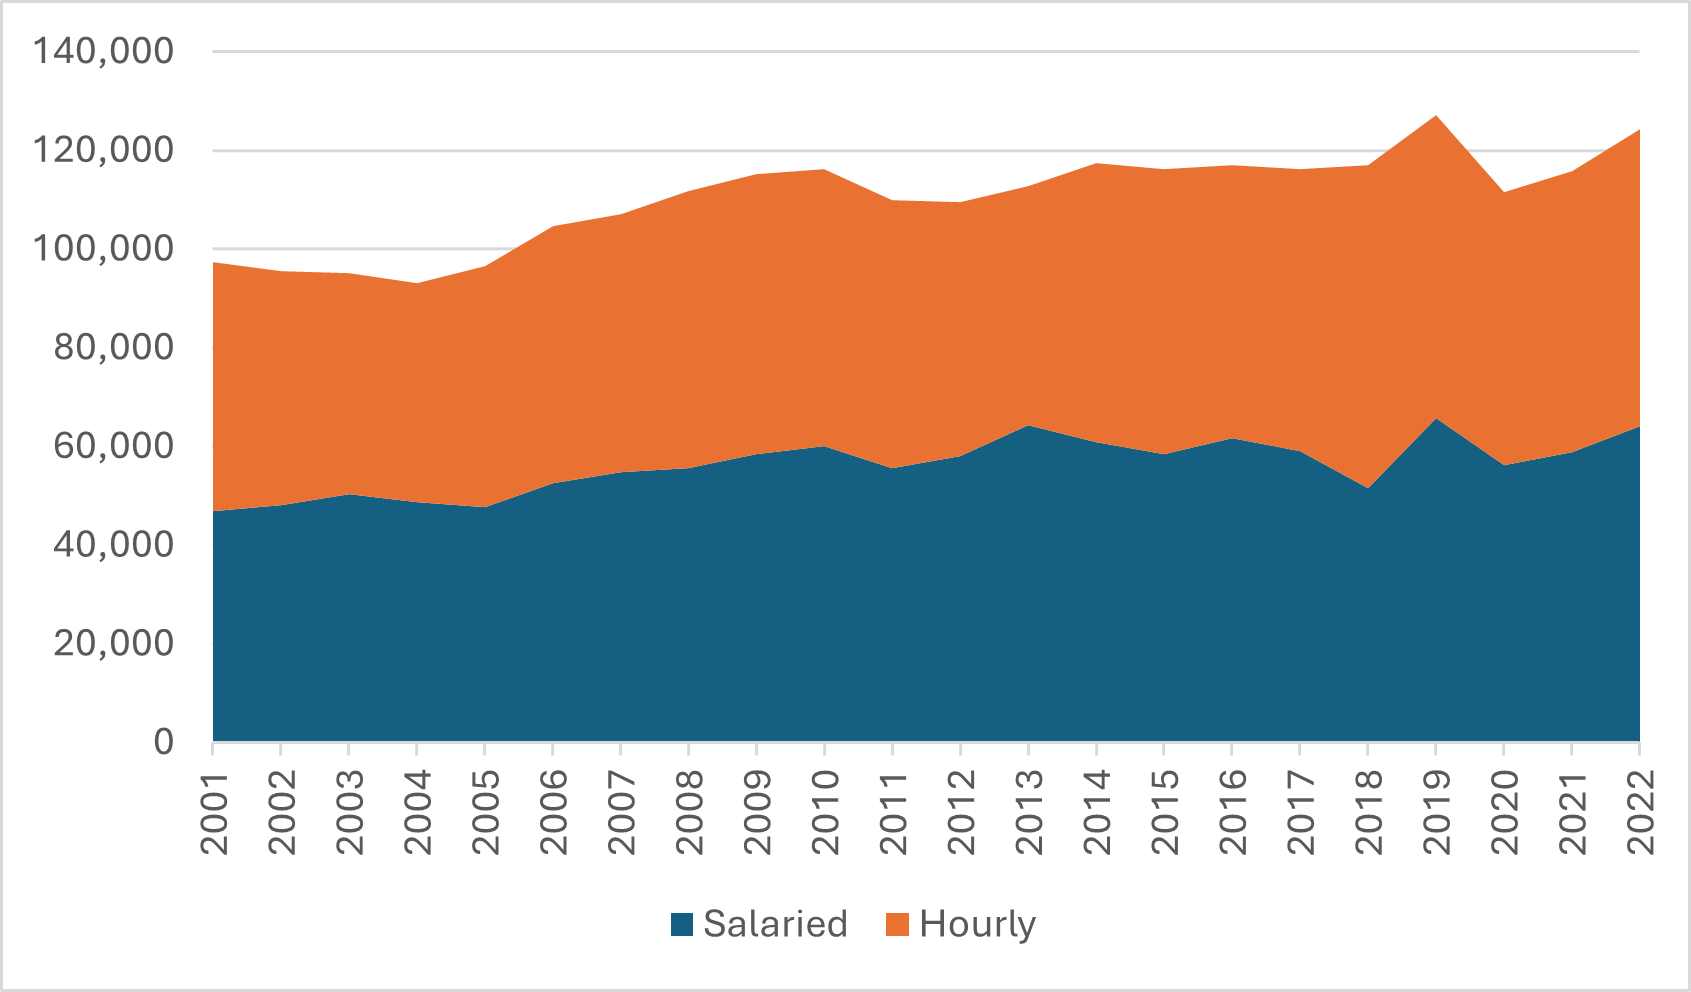
But here’s where it gets a bit weird. If you check the LFS data on full-time employment of college instructors you get a figure of about 55,000. But as you can see in Figure 3, total salaried employment at colleges is only about 60,000. Which would imply that total salaried employment of non-academics is only about 5,000. This simply isn’t true. It is certainly the case that the ratio of non-academics to academics at universities is probably higher than it is at colleges. But the idea that there are 16 times as many non-academic staff at universities than at colleges is simply risible.
Now, clearly LFS and SEPH are measuring different concepts in different ways, and we probably shouldn’t expect things to line up perfectly. But this is a very big discrepancy with no obvious explanation. Which is why you should always take these kinds of survey-based results with a big grain of salt, especially compared to data from administrative databases like UCASS. The data you get from them is indicative, but at the same time only approximate. Use with care.


One Response
Many public colleges hire outside firms, such as Talent Map, to administer “climate surveys” (some colleges call them “Employee Engagement Surveys”) every 2-3 years.
These climate surveys usually provide precise numbers, such as “Total Number of Administrative Employees and Total Number of Survey Respondents.” The numbers are often quite granular, too, broken down to the divisional, service and departmental levels. The only missing piece is employee numbers for the public-private partnership campuses, which are almost entirely an Ontario colleges thing, and employees at those campuses are never included in the surveys.
You absolutely can mine the raw survey data and construct the employment numbers you seek. The information should be publicly available.