Y’all probably remember me talking about how Canada is eating the future by spending tons of money on consumption but not enough on real investments that pay dividends down the line. Today, I want to show you a prime example of that, and this: spending on the elderly.
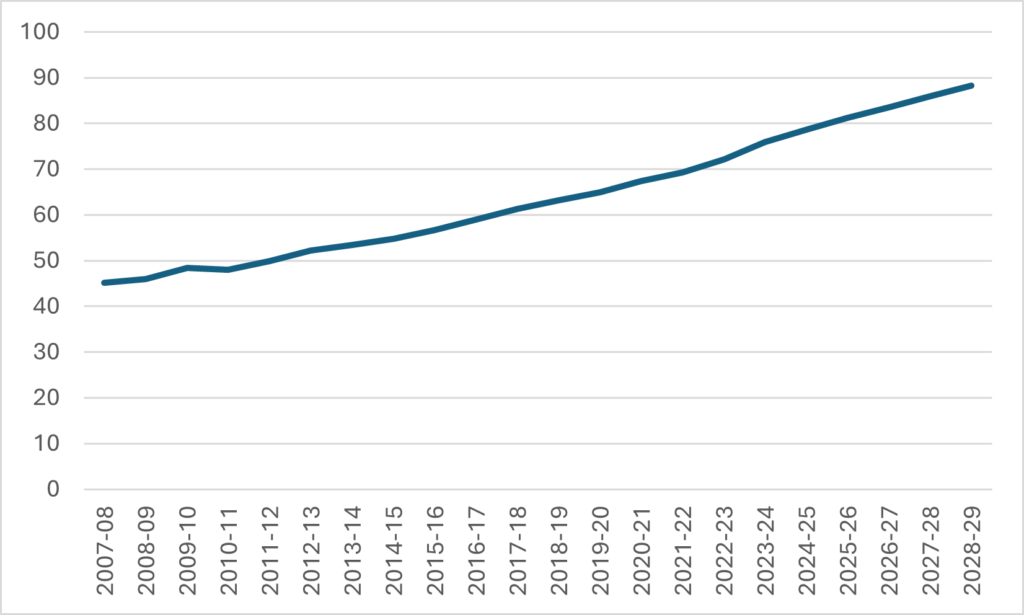
In every budget there is a line-item called “Elderly benefits” which includes Old Age Security (the non-contributory pension everyone over 65 gets) and the Guaranteed income Supplement (the means-tested income boost for low-income seniors). We are spending a crapload of money on this. Figure 1 takes data from various federal budgets over the last year to look back to 2007-08 and then forward again to 2027-28 and puts the expenditures in constant, inflation-adjusted 2023 dollars (future inflation is estimated at 2.5% per year). In 2007-08, Canada spent $45B on transfers to the elderly; By 2027-28, just twenty years later, that figure is expected to double to about $90B (again, this is after inflation).
Figure 1: Federal Government Elderly Benefits, 2007-08 to 2027-28, in Billions of $2023

Most of this change comes from an increase in the number of old people: OAS and GIS have stayed pretty constant in terms of generosity over the past 20 years: the only exception was a boost to OAS for over-75s in the first Trudeau government. Note that the sum does not include the Canada Pension Plan because it is paid out of contributions rather than government funding, and nor am I including a number of other related tax benefits or COVID-related benefits.
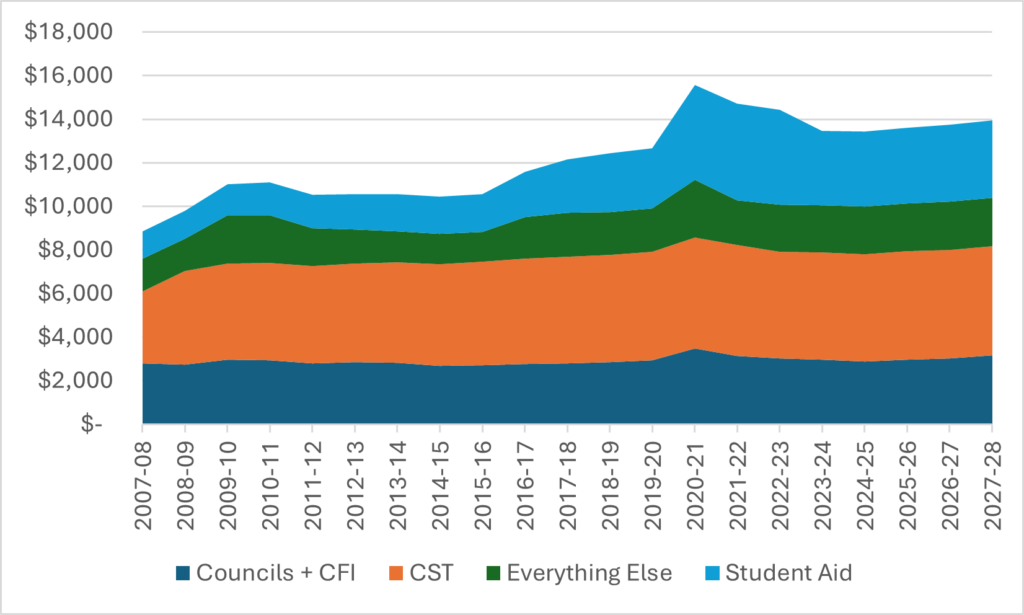
So, that’s consumption expenditure. But let’s also look at investment—in this case, money for postsecondary education. This comes in four buckets: money paid to provinces in respect of PSE via the Canada Social Transfer, money paid to researchers and institutions through the tri-councils and the Canada Foundation for Innovation (CFI), non-repayable student aid, meaning federal grants through the Canada Student Financial Aid Program and the Canada Education Savings Grant, and then a grab-bag “everything else” (for the sake of simplicity I am not going to include the cost of loans and nor will I—to parallel the approach to elderly benefits—any student-oriented tax credits or COVID benefits.
Figure 2 shows how these four different types of funding have evolved over the past, and how they will in theory evolve over the next few years, assuming: i) 3% nominal increases in CST, student aid and “everything else,” ii) the funding for research announced in the 2024 Budget actually comes to pass, and iii) inflation out to 2028 stays at 2.5%. Basically, what it shows is that transfer to institutions have risen fairly slowly (apart from a one-time COVID bump) over the past decade and a half and that the only part of federal expenditures on PSE that have really moved have been transfers to students (though these expenditures have recently fallen from all-time highs due to the federal government’s decision to reduce grants from a COVID-induced maximum of $6,000 per year to $4,200 per year).
Figure 2: Federal Expenditures on Post-Secondary Education, 2007-08 to 2027-28, in Millions of $2023

(NB: As I was drawing this graph I realized I made a pretty big mistake about six months ago in our budget-night commentary on historical funding levels for the tri-councils and CFI. Quite a mortifying one actually, because it resulted in a graph I have used repeatedly—and incorrectly—several times in the months since. I’m issuing an errata/ mea culpa, which you can see here).
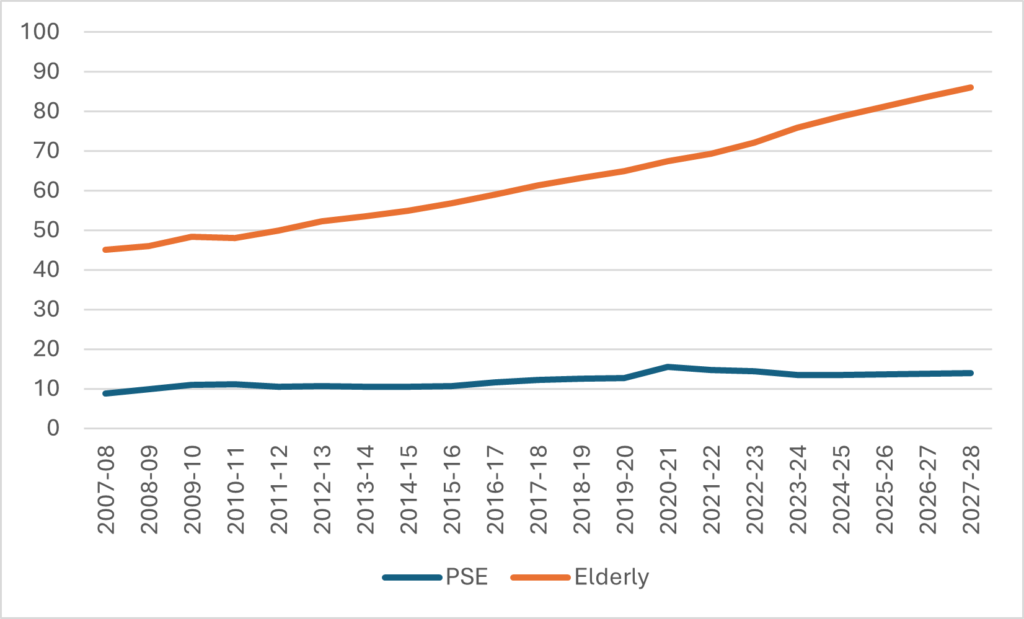
Now, you can probably see where I am going with this. If you compare federal spending for the elderly vs. federal spending for postsecondary education, you get Figure 3.
Figure 3: Annual Federal Expenditures, Elderly Benefits vs. Post-Secondary Education, 2007-08 to 2027-28, in Millions of $2023

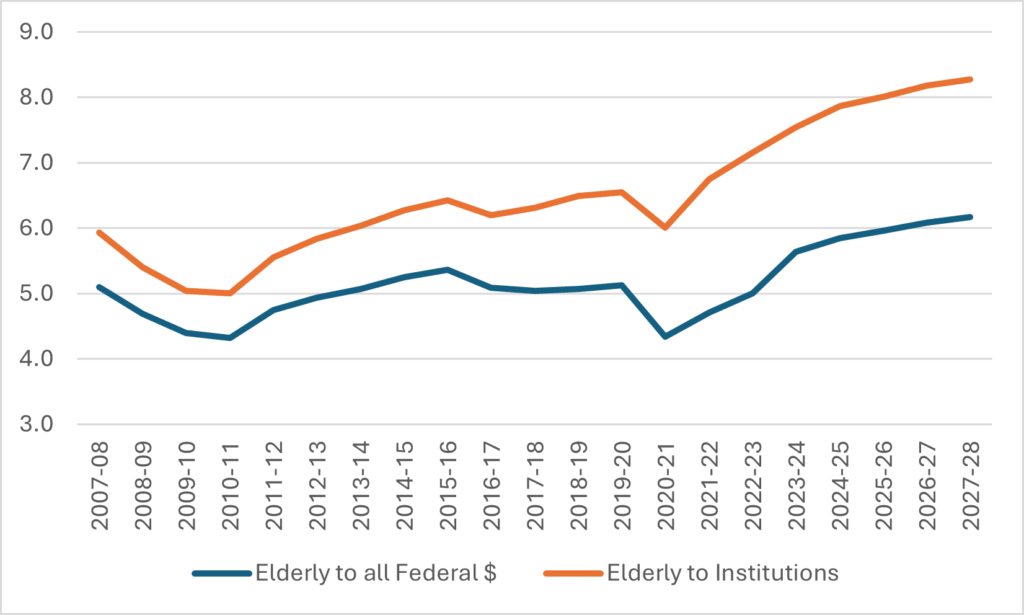
Or, if you prefer things expressed as multiples of one another, it looks like Figure 4. In just 15 years or so, we’ve gone from payments to the elderly being 4.5 times what we spend on post-secondary education to 6 times. Or, if we exclude payments to students (which, let’s face it, are to some extent consumption rather than investment), the ratio has jumped from 5:1 to 8:1.
Figure 4: Ratio of Federal Expenditures on Elderly Benefits to Expenditures on Post-Secondary Education, 2007-08 to 2027-28

And remember: the opposition parties banded together in the House of Commons recently to vote to make this worse by bumping up OAS benefits even more. This problem is only going to get worse. Our prosperity as a country is at risk because we simply are spending too few tax dollars on the things that will increase future productivity
Now, I know many of you will absolutely loathe the comparison I have just made. I can hear many of you saying something like “why pit these two as competitors? Why not look at things that really make up poor like useless subsidies for corporate oil and gas/useless corporate green subsidies (pick one). Well, ok, but both of those sets of subsidies are tiny in comparison. Total Oil and Gas subsidies form the feds equal about $3 billion per year, and if you spread the absurd battery plant subsidies to which the feds have committed themselves over the decade or so they are to be spent, then the green subsidies come out to about the same amount. Elderly benefits in 2027 are projected to be $90 Billion. That’s almost as much as the feds send in totalto the provinces through the Health Transfer, the Social Transfer, and Equalization combined, and the benefits are rising at a much faster rate.
There’s not much anyone can do about this, obviously. Even if reducing OAS were a good idea on its own merits, the elderly and soon-to-be-elderly are such a powerful voting block that adjusting it downwards would be politically nearly impossible. And so barring a generalized tax increase (difficult to imagine when politics are obsessed with “affordability”) there is simply a shrinking pool of funds available for pro-growth investments like higher education and research.
Our demographics shape our political economy. And right now, it is shaped specifically in order to eat the future. Plan your institutional finances accordingly.

 Tweet this post

How does the spending look on a constant-dollar per-capita basis (i.e., $ per senior recieving these benefits), $ per student supported)?
Maybe a minor issue, but does Figure 1 use the gross or net OAS expenditure? Since OAS is clawed back above a certain income level the net expenses would be lower.
There is another issue here — as more Canadians work in the gig economy, fewer are paying into or having their employer pay into pension plans. So we will increasingly have an army of seniors with no other resources. For those with good pensions, the OAS mostly gets clawed back, and obviously the GIS doesn’t happen. But once a large segment of elderly have nothing but the federal funds, watch out.
Many employers do not provide any retirement benefits to their staff, necessitating significant government intervention. Does HESA provide its staff with a pension, group RRSP, or something similar? If it doesn’t, this eating the future framing may be apt for an unintended reason.