


Some very early National Graduates Survey (NGS) results are out, and they’re mostly good news. The NGS – for the uninitiated – surveys university and college graduates two years after graduation. It’s closely watched for its numbers on graduate employment, income, and debt. Statscan has been doing this now for a little over thirty years (the first one was on the class of 1982), and since 1990 it has been conducted every five years.
Usually, when Statscan does a major survey, it “launches” with an analytical report and the release of a public-use microdata file (PUMF). This time, however, they chose to do neither, which is more than a bit weird. It’s welcome in the sense that it gets data into the public domain more quickly, but unwelcome in the sense that the only data available is what you get via a set of highly truncated standard tables (no debt data this year, for a start) and what people can order via custom tables for hundreds – possibly thousands – of dollars. I’ve ordered quite a bit of data, which I can hopefully share with all of you relatively soon, but for today we’re only going with what’s in the standard tables.
Are you sitting comfortably? Then I’ll begin.
The picture on employment and immigration looks pretty good. To be clear about what’s being shown here, NGS only releases data on graduates who finished a level of study but who did not take any further education. In theory, this is a way of making comparisons more apples-to-apples: it avoids methodological problems of adding incomes of BA students who went on to do a 1-year Master’s degree in with students who just did a Bachelor’s degree. It’s less than totally satisfactory, but it has the benefit of simplicity. Anyways, here’s what the employment data looks like for college and Bachelor’s grads:
Full- and Part-time Employment Rates for College and Bachelor’s Graduates Two Years After Graduation, NGS 2005 (in 2007) and 2010 (in 2012)
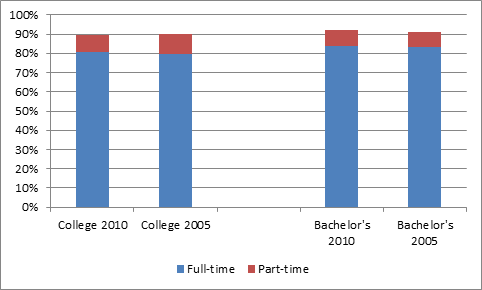
Got that? From the height of the boom to the middle of the current “recession”, there’s essentially no difference either in terms of overall employment or in terms of full-time employment. To the extent that there are people struggling and having a hard time finding a job, it’s business as usual: the proportion has not changed since the height of the boom (for both college and university grads, unemployment rates in both periods were 5%, with another 5% not in the labour force).
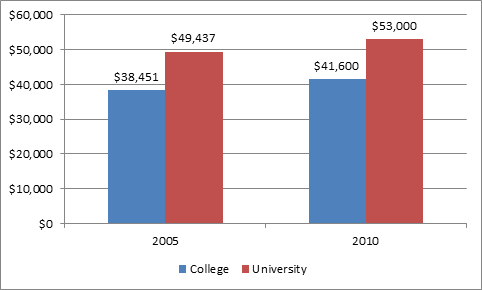
Ok, you say, but what about income? Surely the recession has done a real number on graduates’ salaries? Well, no. Adjusted for inflation, there’s been a rise in median salaries of 7% for Bachelor’s graduates and 8% for college graduates.
Median Salaries of College and Bachelor’s Graduates Two Years After Graduation, NGS 2005 (in 2007) and 2010 (in 2012), in $2012
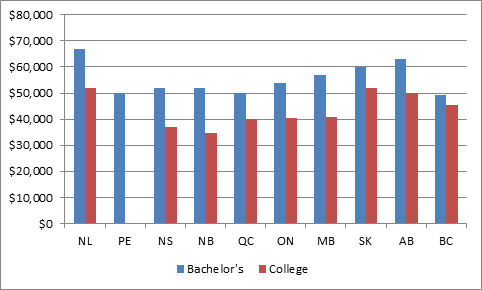
My favourite crazy pieces of data from NGS, though, are the province-by-province figures. Check out Newfoundland, which according to NGS now pumps out the country’s best-off college and university graduates:
These are all good stories, worth keeping in your armoury next time someone whines about skills gaps or spouts some nonsense about a lost generation. But there are a few caveats to this story. I’ll deal with them tomorrow.


4 Responses
A recent article on University Affairs raised an interesting question, probably not soluble using the Statscan data: Could the so-called “lost generation” consist of students who passed, but only passed? I’ve certainly had students who graduated with C’s and D’s in enough courses, but basically learnt very little, perhaps because they were preoccupied elsewhere. I’d blame our obsession with “going to university” over challenging oneself intellectually.
The article, btw, is here: http://www.universityaffairs.ca/the-lost-generation-of-university-graduates.aspx
Why does this trend not reflect the labour force unemployment data, where the trend does not show unemployment rates staying the same for any cohort except the older degree holders? Is there something going on with response bias?
Response rate was only 49.5% on this one (more on this subject tomorrow) but doesn;t seem to be an age thing – pattern is same as last time for bachelor’s – median age 24 avg age 26.
Any chance you could post provincial salary data in table form? Stats Can doesn’t seem to have it online yet.