


Yesterday, I showed you some charts on graduate outcomes indicating that the kids were – mostly – alright: employment steady, Full-time employment steady, graduate incomes steady, etc. But there are three significant reasons to be cautious about over-interpreting these results.
The first is that this year’s NGS was conducted differently from previous iterations. In previous years, the survey was conducted two years after graduation. This year, the survey was done three years out, with graduates being interviewed in 2013 about what their situation was in 2012, to try to keep the 2-year time frame. This creates an array of small biases in responses, though whether it creates over- or under-estimation of employment and income is hard to say.
The second caveat has to do with the survey response rate. In 2000, the NGS response rate was 70%; this year’s response rate was 49%, which has to be one of the lowest ever seen in a Statscan survey. Partly, this is probably an artefact of waiting an extra year to survey students, and partly it’s that students are getting harder to follow (when you survey on landlines, the caller eats the cost – on cell phones, part of the cost burden falls on the respondent, which can’t be good for response rates).
The third problem is the trickiest. When Statscan reports income and employment figures, it does so only for those students who do not enrol in programs leading to further certification. This eliminates some problematic data from people who are either still in school, or who have gained an additional credential (which is good), but at the same time it creates problems because the proportion excluded changes over the economic cycle.
Percentage of College and Bachelor’s Graduates Seeking Additional Certifications Within 2 Years of Graduation
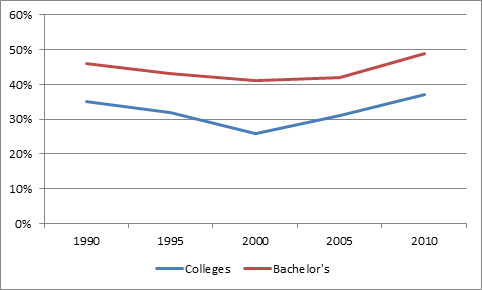
The suspicious might look at this and say: “holy moley! The NGS data on income and employment ignores half of all university graduates – surely that’s where all the underemployed barista sociology graduates are! Skills Mismatch Bingo!”
But slow down a minute. First, the rates at which college and university grads attempt to acquire extra credentials mirror one another; this is not clear evidence in favour of a “college-grads-have-it-better-
Second, it’s not at all clear that, among university grads, the phenomenon is disproportionately due to Arts grads. Even in the best of economic times, 40% of university grads continue on to extra credentials, and they come from all across the university. The proportions by field of study for 2005 (2010 numbers not yet available) actually showed that Science students (62%) were more likely to do so than humanities (56%) and social science (45%) grads (Fine arts was at 38%, engineering, math, and computer science grads were at 30%).
All of which is to say: while the employment and income data from NGS are technically apples-to-apples comparisons, the fact is that the basis of these comparisons varies slightly from survey to survey. Some of the good news on graduate income and employment rates is probably due more to students choosing to take extra education rather than brave the job market. It thus probably isn’t entirely fair to say that the 2012 data implies things are getting better for grads.
That said, you can’t twist this evidence to support the idea that there has been a radical change in the labour market for graduates. It’s mostly as it’s always been, with a slight up-tick in people taking more than one credential.
So can we please ditch the “everything is different” narratives and get back to real issues now?

