Last month, right around the time the blog was shutting down, the OECD released its report on the second iteration of the Programme for International Assessment for Adult Competencies (PIAAC), titled “Do Adults Have the Skills They Need to Thrive in a Changing World?”. Think of it perhaps as PISA for grown-ups, providing a broadly useful cross-national comparison of basic cognitive skills which are key to labour market success and overall productivity. You are forgiven if you didn’t hear about it: its news impact was equivalent to the proverbial tree falling in a forest. Today, I will skim briefly over the results, but more importantly, ponder why this kind of data does not generate much news.
First administered in 2011, PIAAC consists of three parts: a test for literacy, numeracy, and what they call “adaptive problem solving” (this last one has changed a bit—in the previous iteration it was something called “problem-solving in technology-rich environments). The test scale for is from 0 to 500, and individuals are categorized as being in one of six “bands” (1 through 5, with 5 being the highest, and a “below 1,” which is the lowest). National scores across all three of these areas are highly correlated, which is to say that if country is at the top or bottom, or even in the middle on literacy, it’s almost certainly pretty close to the same rank order for numeracy and problem solving as well. National scores all cluster in the 200 to 300 range.
One of the interesting—and frankly somewhat terrifying—discoveries of PIAAC 2 is that literacy and numeracy scores are down in most of the OECD outside of northern Europe. Across all participating countries, literacy is down fifteen points, and numeracy by seven. Canada is about even in literacy and up slightly in numeracy—this is one trend it’s good to buck. The reason for this is somewhat mysterious—an aging population probably has something to do with it, because literacy and numeracy do start to fall off with age (scores peak in the 25-34 age bracket)—but I would be interested to see more work on the role of smart phones. Maybe it isn’t just teenagers whose brains are getting wrecked?
The overall findings actually aren’t that interesting. The OECD hasn’t repeated some of the analyses that made the first report so fascinating (results were a little too interesting, I guess), so what we get are some fairly broad banalities—scores rise with education levels, but also with parents’ education levels; employment rates and income rise with skills levels; there is broadly a lot of skill mis-match across all economies, and this is a Bad Thing (I am not sure it is anywhere near as bad as OECD assumes, but whatever). What remains interesting, once you read over all the report, are the subtle differences one picks up in the results from one country to another.
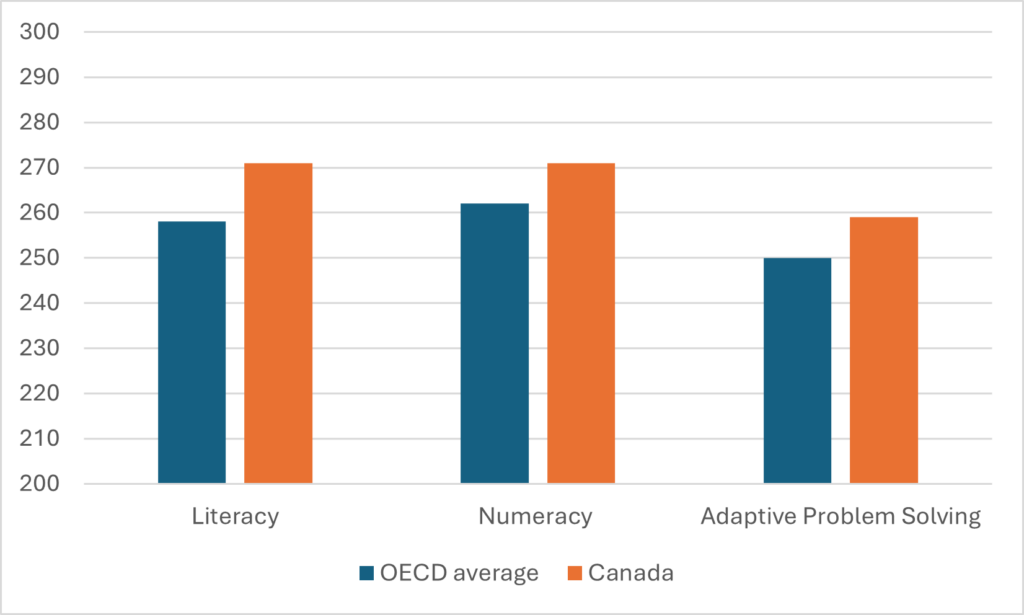
So, how does Canada do, you ask? Well, as Figure 1 shows, we are considered to be ahead of the OECD average, which is good so far as it goes. However, we’re not at the top. The head of the class across all measures are Finland, Japan, and Sweden, followed reasonably closely by the Netherlands and Norway. Canada is in a peloton behind that with a group including Denmark, Germany, Switzerland, Estonia, the Flemish region of Belgium, and maybe England. This is basically Canada’s sweet spot in everything when it comes to education, skills, and research: good but not great, and it looks worse if you adjust for the amount of money we spend on this stuff.
Figure 1: Key PIAAC scores, Canada vs OECD, 2022-23

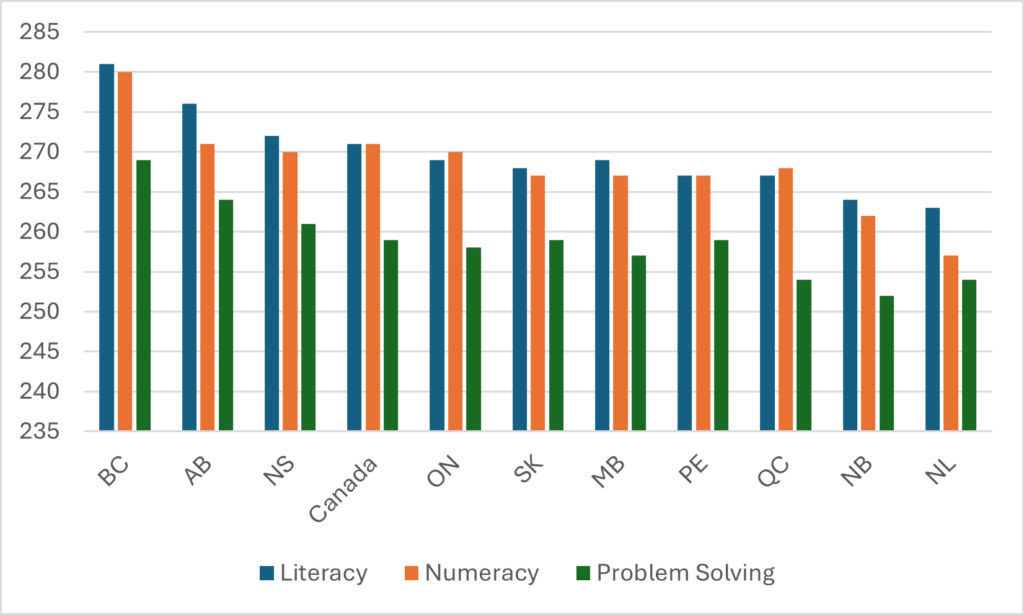
Canadian results can also be broken down by province, as in Figure 2, below. Results do not vary much across most of the country. Nova Scotia, Ontario, Saskatchewan, Manitoba, Prince Edward Island, and Quebec all cluster pretty tightly around the national average. British Columbia and Alberta are significantly above that average, while New Brunswick and Newfoundland are significantly below it. Partly, of course, this has to do with things you’d expect like provincial income, school policies, etc. But remember that this is across entire populations, not school leavers, and so internal immigration plays a role here too. Broadly speaking, New Brunswick and Newfoundland lose a lot of skills to places further west, while British Columbia and Alberta are big recipients of immigration from places further east (international migration tends to reduce average scores: language skills matter and taking the test in a non-native tongue tends to result in lower overall results).
Figure 2: Average PIAAC scores by province, 2022-23

Anyways, none of this is particularly surprising or perhaps even all that interesting. What I think is interesting is how differently this data release was handled from the one ten years ago. When the first PIAAC was released a decade ago, Statistics Canada and the Council of Ministers of Education, Canada (CMEC) published a 110-page analysis of the results (which I analyzed in two posts, one on Indigenous and immigrant populations, and another on Canadian results more broadly) and an additional 300(!)-page report lining up the PIAAC data with data on formal and informal adult learning. It was, all in all, pretty impressive. This time, CMEC published a one-pager which linked to a Statscan page which contains all of three charts and two infographics (fortunately, the OECD itself put out a 10-pager that is significantly better than anything domestic analysis). But I think all of this points to something pretty important, which is this:
Canadian governments no longer care about skills. At least not in the sense that PIAAC (or PISA for that matter) measures them.
What they care about instead are shortages of very particular types of skilled workers, specifically health professions and the construction trades (which together make up about 20% of the workforce). Provincial governments will throw any amount of money at training in these two sets of occupations because they are seen as bottlenecks in a couple of key sectors of the economy. They won’t think about the quality of the training being given or the organization of work in the sector (maybe we wouldn’t need to train as many people if the labour produced by such training was more productive?). God forbid. I mean that would be difficult. Complex. Requiring sustained expert dialogue between multiple stakeholders/partners. No, far easier just to crank out more graduates, by lowering standards if necessary (a truly North Korean strategy).
But actual transversal skills? The kind that make the whole economy (not just a politically sensitive 20%) more productive? I can’t name a single government in Canada that gives a rat’s hairy behind. They used to, twenty or thirty years ago. But then we started eating the future. Now, policy capacity around this kind of thing has atrophied to the point where literally no one cares when a big study like PIAAC comes out.
I don’t know why we bother, to be honest. If provincial governments and their ministries of education in particular (personified in this case by CMEC) can’t be arsed to care about something as basic as the skill level of the population, why spend millions collecting the data? Maybe just admit our profound mediocrity and move on.

 Tweet this post
