


Ok, after nine years of this blog, you all know the drill. Yesterday was about university income trends, so that means today covers expenditures.
Let’s start by looking at expenditures by type. Universities are labour-intensive places, with 59% of total expenditures devoted to compensation of one sort or another (if we were to look just at operating expenditures, it would be higher). About 10% goes into new buildings, building renovations, utilities and general upkeep. Another ten percent is devoted “buying stuff” (materials, supplies, equipment, furniture, library acquisitions, etc.), six percent goes to scholarships, five to various types of professional fees and contracted services, and ten percent to everything else.
Figure 1: University Expenditures by type, in $ Billions and % of total, 2018-19
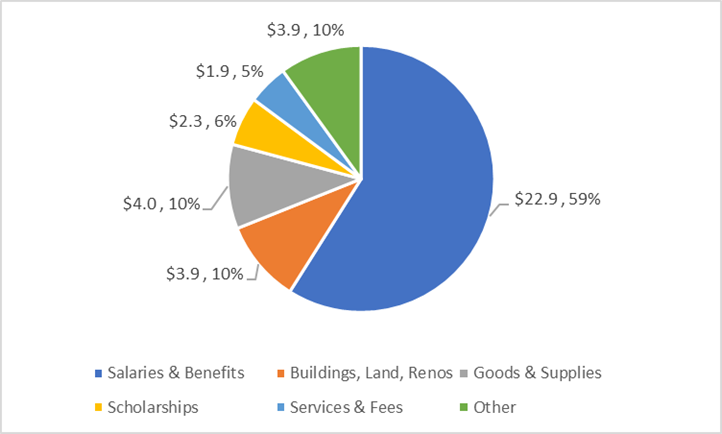
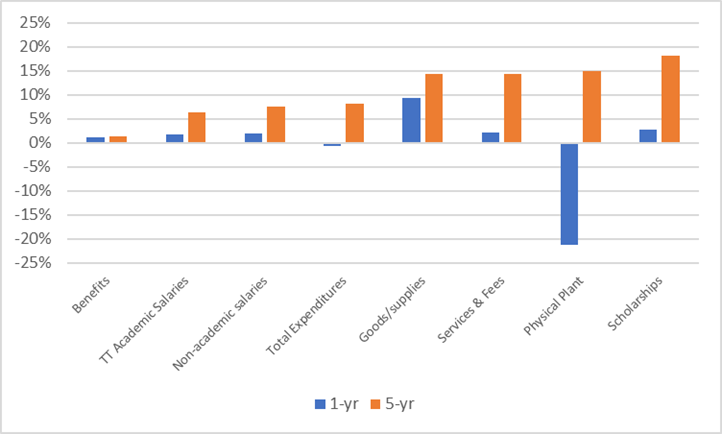
Figure 2 looks at major expenditure categories and their absolute change over one and five years. The big news here is that there was a pretty big drop in spending on physical plant (i.e. buildings and renovations) in 2018-19, which I am fairly sure we can attribute to the winding down of the federal Strategic Infrastructure Fund (SIF). The longer-term picture is perhaps a bit more interesting. Over the past five years, expenditures on physical goods, as well as on external service and fees (a good chunk of which seems to be IT services), is increasing at about twice the rate that salaries are increasing. And the fastest-growing line item in the budget? Scholarships. And yes, ok, this is partly an accounting convention (“scholarships” rise in part along with rising graduate tuition fees that routinely get waived for research doctoral students), but still: this is money which is in effect not available for other purposes, either.
Figure 2: Growth in Real Expenditures over 1- and 5-years, by Selected Types, Canadian Universities, 2018-19
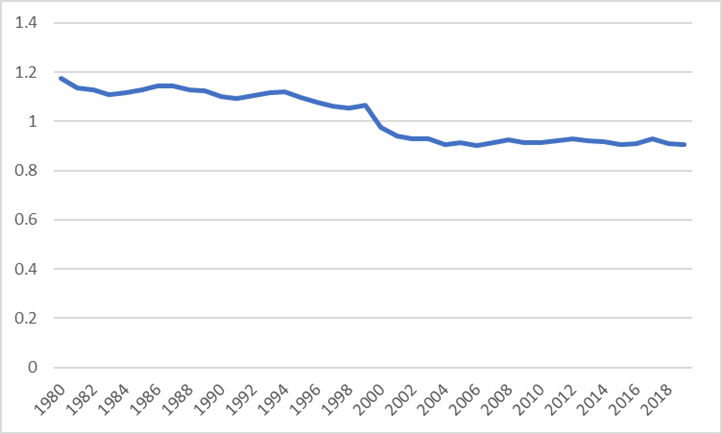
Now, Figure 3 is pretty much obligatory on this blog because if there is one thing I can’t stand, it’s the never-ending natter about “non-academic staff” are simply swamping universities, crowding out spending on faculty, etc. Now, such crowding out may have been a feature of the 1990s, but since about 2000 (the year after Statscan introduced some new definitions which created a one-time jump and series break in spending on non-academics), the ratio of spending on academics to non-academics has been bouncing around in a very narrow band. Hardly evidence of continuing rapaciousness.
Figure 3: Ratio of Salaries paid to Ranked Academic Faculty vs. Salaries Paid to Non-Academics, 1979-80 to 2018-19
Turning to the division of operating funds by function, we find that “instructional” expenditures make up 59% of total operating spending at universities (at a high level of approximation, the definition of “instructional” spending means any spending you can apportion to a specific academic Dean or academic faculty). The next big areas of expenditures are administration at 13% (if you include all “external relations”, meaning community/government relations plus fundraisers, which now accounts for a non-trivial $602 million nationally). Student services and physical plant each account for roughly 10% of total operating expenditures, while ICT and Libraries each account for roughly 4%. It is of interest that in 2018-19 student services spending nudged ahead of physical plant as the third-largest area of institutional expenditures for the first time ever.
Figure 4: Operating Expenditures by Function, in $ Billions and as % of total, Canadian Universities, 2018-19
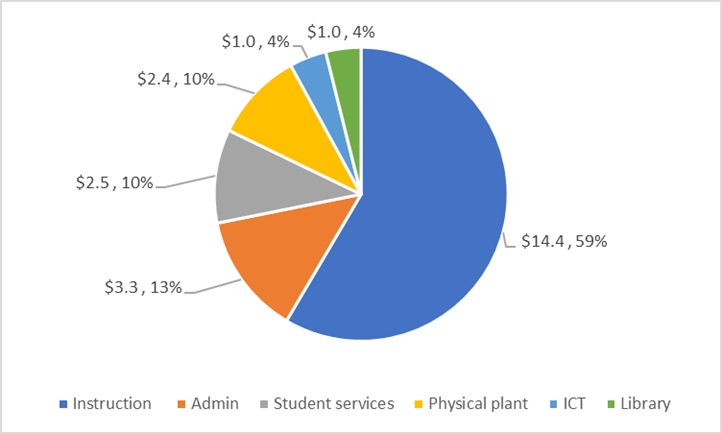
Figure 5 demonstrates growth in spending over the past few years. In this graph, I disaggregate “external relations” from the rest of administrative spending because while it is not a very chunk of overall spending (about 2.5% of total) it is also the portion of spending which is rising the most quickly, growing by 17.4% in inflation-adjusted dollars over the past five years. This raises interesting questions: one might suggest that since total government plus philanthropic dollars are stagnant over the past five years, this might not be money well spent. On the other hand, we can’t run a counter-factual here: perhaps results would have been a lot worse without all that money in external relations? Lord knows it’s a much less-friendly environment out there these days.
Figure 5: Change in Real Expenditures by Function, Canadian Universities, 2013-14 to 2018-19
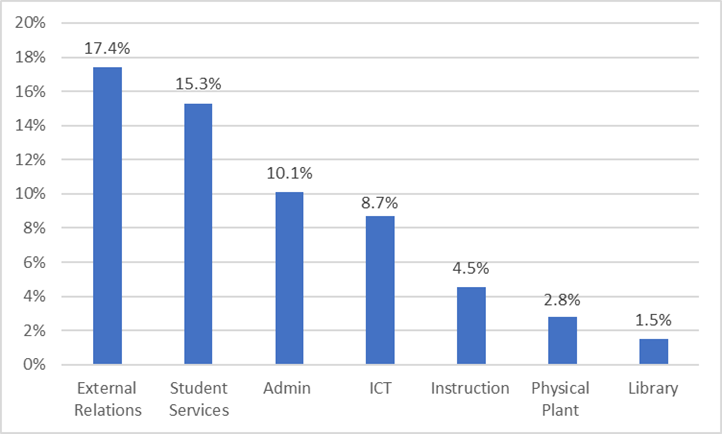
Apart from the external relations file, what we’re seeing is that within the global operating budget (which grew 6.3% over the five years to 2018-19), the big winners were student services, central administration and ICT. Instructional costs grew more slowly than the overall operating budget, although this was in part because institutions on the whole have spend the past five years eviscerating what is known as the “non-credit” (i.e. Continuing Education) instructional budget, which frankly is awkward given that everyone is about to go hogwild for micro-credentials. Libraries, as usual, are pulling up the rear of this spending train.
Anyway, the bottom line here is that expenditures of all types are continuing to grow faster than inflation, despite essentially zero growth in either domestic government expenditures or real domestic tuition fees. God bless international students.

