Morning everyone. You know the drill by now, since we’ve already done this for Nova Scotia and Alberta. So, let’s get going.
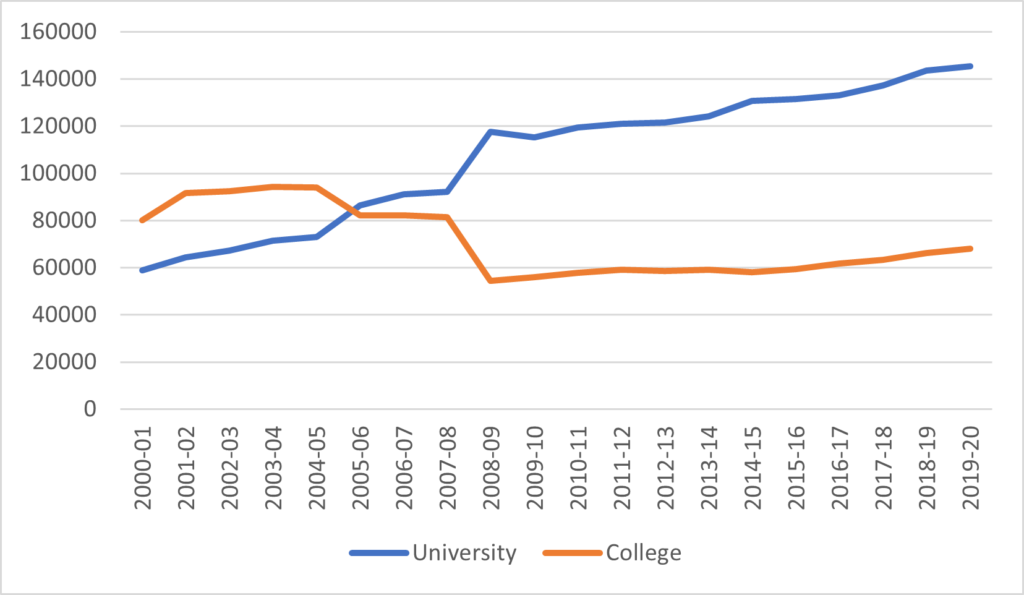
Let’s start with student numbers. British Columbia is very much like Alberta in the sense that it used to be a province where college students outnumbered university students until several institutions switched from being colleges to universities and everything switched. In BC, we see this in 2008-09, which is when Emily Carr University of Art and Design, Vancouver Island University, the University of the Fraser Valley, Kwantlen Polytechnic and Capilano University all starting reporting as universities into the Statistics Canada database. Where BC and Alberta differ is that in Alberta enrolments in the college sector rebounded after the one-time shift; in British Columbia, college enrolments stayed more or less stale for close to a decade until they started rising again with the arrival of thousands of international students starting in about 2017 (domestic enrolments in BC college are currently lower than at any point in the last thirty years).
Figure 1: Full-time Equivalent Students, by Sector, 2000-01 to 2019-20
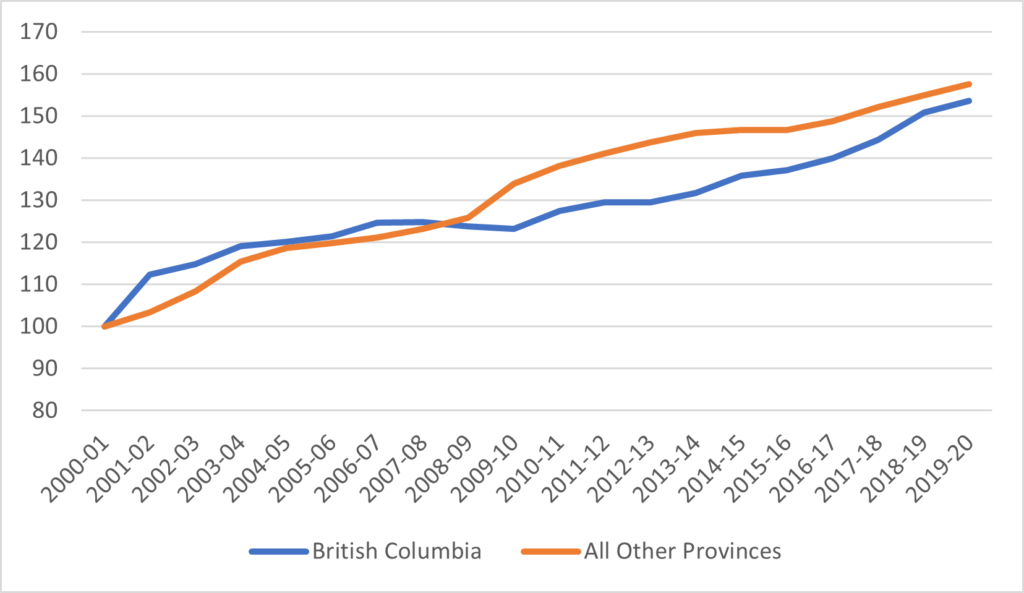
Historically, British Columbia has tended to have fewer post-secondary seats, relative to population, than other provinces. However, since 2000, growth in enrolments within the province has risen more or less in parallel with the national levels of growth.
Figure 2: Indexed Full-Time Equivalent Post-Secondary Students, British Columbia vs Other 9 Provinces, 2000-01 to 2019-20 (2000-01 = 100)
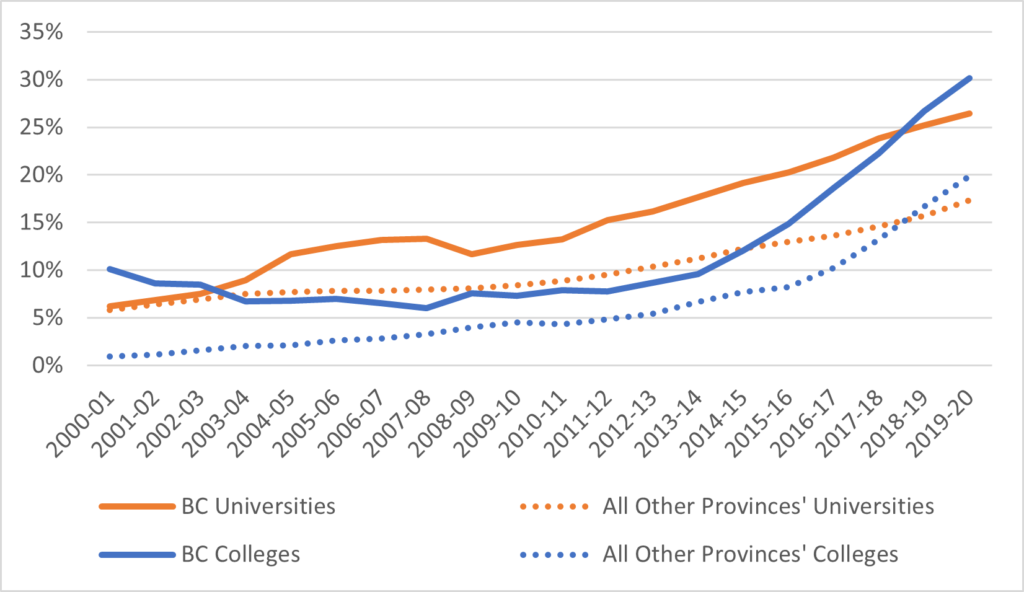
British Columbia has long been home to large numbers of international students. At the university level, international students make up 25% of the student body, while at the college level just over 30% of students are from abroad. In both cases, the proportion of international students in the student body in British Columbia are about 50% higher than in the rest of the country.
Figure 3: Proportion of Students from Outside Canada, by Sector, British Columbia vs other 9 provinces, 2000-01 to 2019-20 (2000-01 = 100)
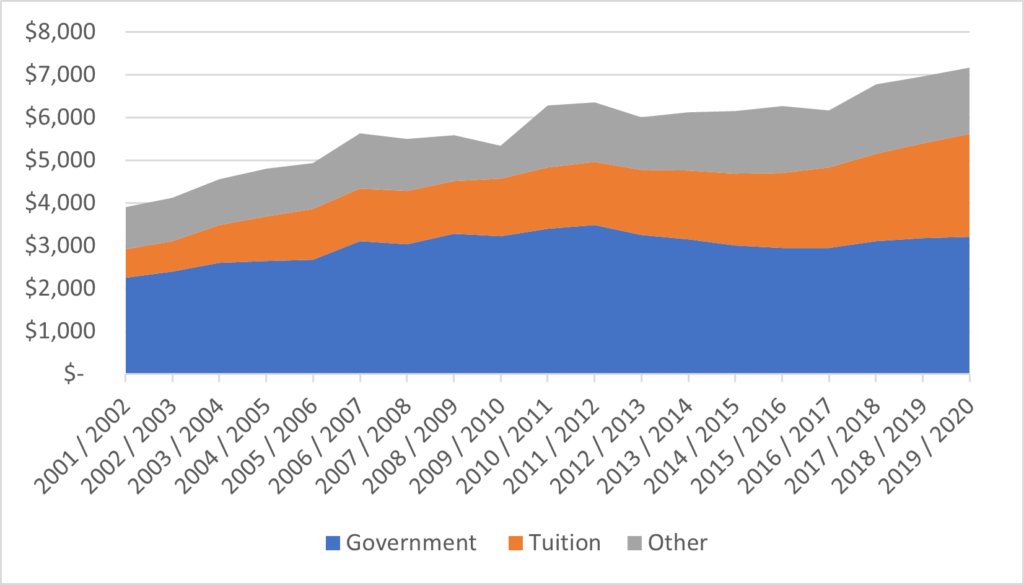
With respect to institutional funding, the picture in British Columbia most closely resembles Ontario: government funding only account for 44% of total institutional income, and income from student tuition – specifically international student tuition–is making up an ever-increasing proportion of income. In total, since 2001, institutional income has risen by 83% – significantly faster than enrolment, meaning that income per student has been rising steadily over the past two decades.
Figure 4: Total PSE Institutional Revenue by Source, British Columbia, 2000-01 to 2019-20, in millions of constant $2019
As Figure 5 shows, overall change in levels of public funding from government in British Columbia has hewn pretty closely to the path of government spending in other provinces. However, tuition income has risen more quickly in BC than elsewhere. As Figure 6 shows, this is not because of drastic increases in domestic tuition fees: in fact, over the past twenty years, tuition increases in British Columbia have actually been more moderate than those across the rest of the country. A more plausible source of change is the growth in international student numbers shown above in Figure 3.
Figure 5: Indexed Change in Institutional Income from Governments and Tuition Fees, BC v. Other 9 Provinces, 2000-01 to 2019-2020 (2000-01 = 100)
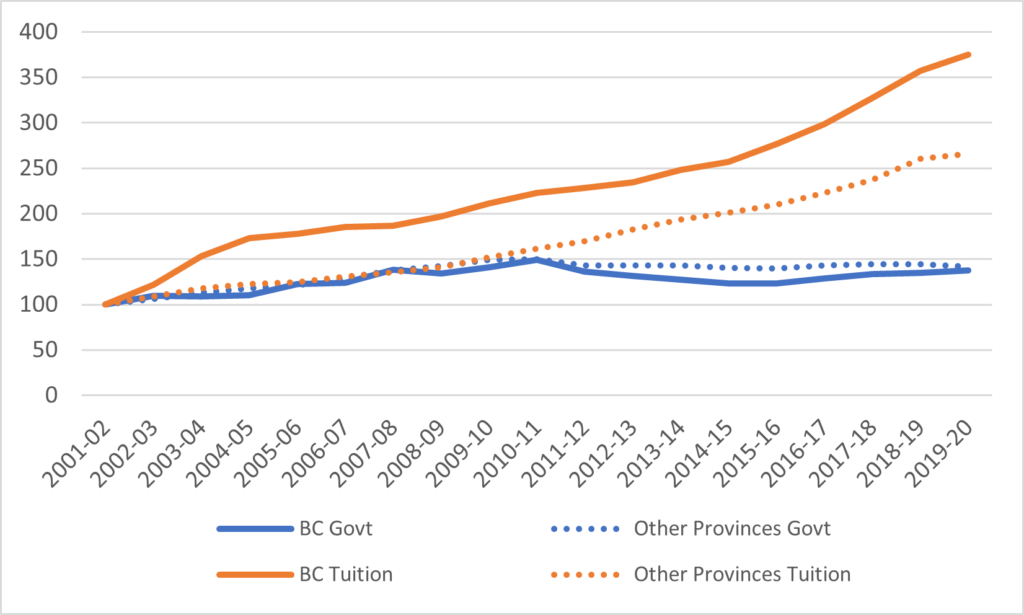
Figure 6: Tuition fees, British Columbia v. Canada, 2006-07 to 2021-22 (in constant $2021)
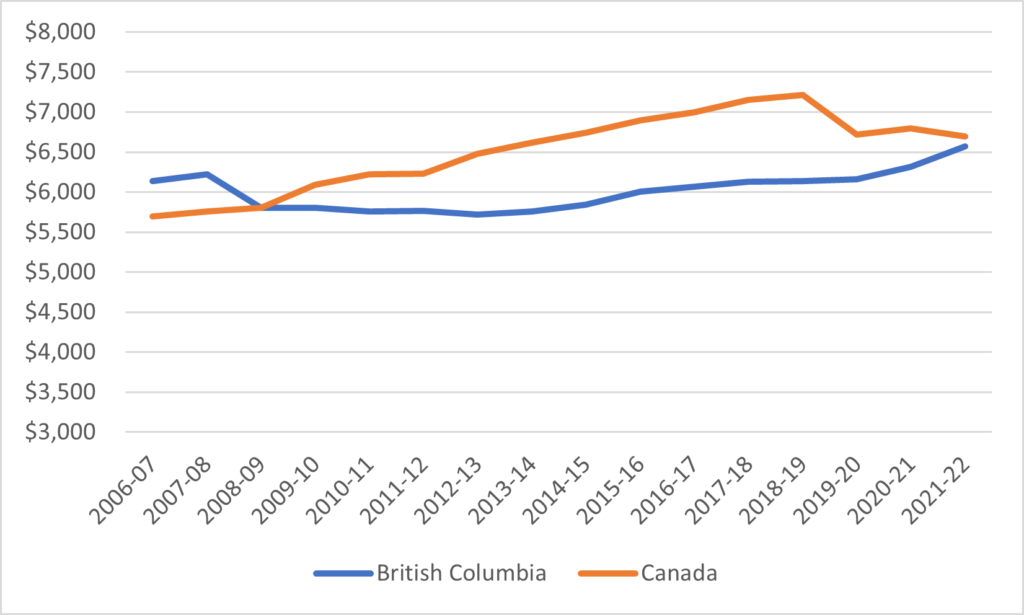
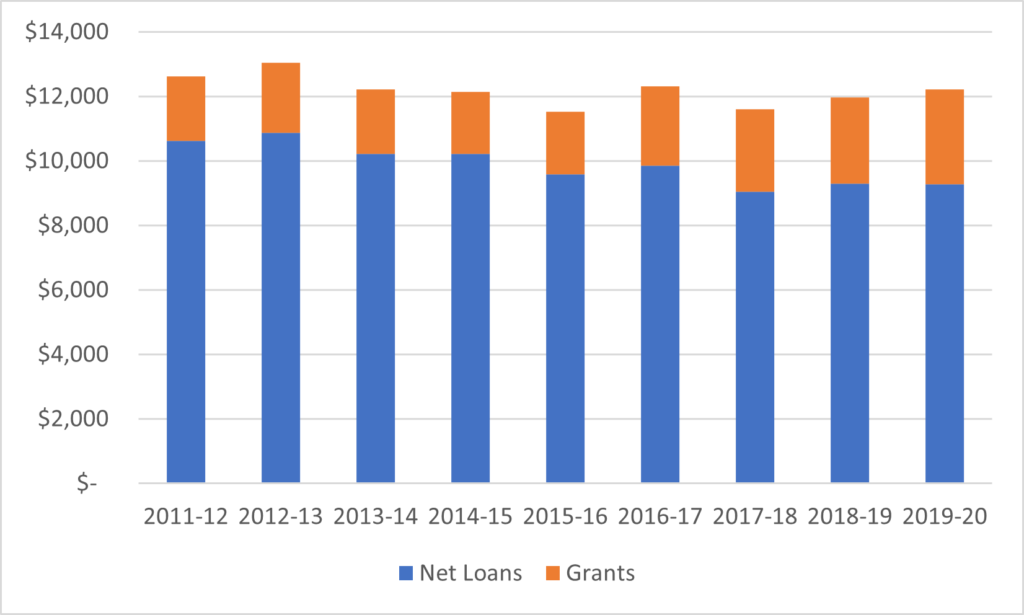
Figure 7 shows the average loan per recipient plus average grant per recipient over time in British Columbia, from both provincial and federal sources (this is not quite the same as an average aid package because not all loan recipients also receive grants). BC students have not seen much change in their aid packages over the past decade: overall aid packages have stayed close to about $12,000 per year, but grants have increased from about 12.5% of the total to a little over 21% of the total.
Figure 7: Average Loan Plus Average Grant Disbursed, British Columbia, 2011-12 to 2019-20, in constant $2019
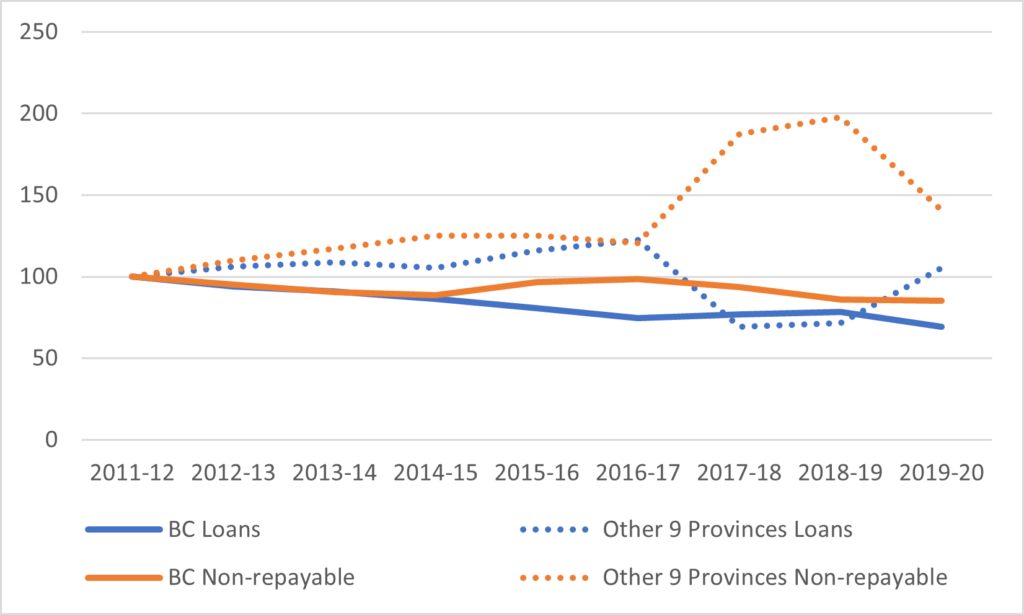
One of the interesting things about British Columbia student aid packages, relative to those in other provinces, is that both the loan and grant portions of assistance have grown more slowly in BC than elsewhere over the past twenty years; indeed, in strict inflation-adjusted terms both total loans and total grants are smaller now than they were 20 years ago. In part, this has to do with the high cost-of living in British Columbia, which means that a very high percentage of the province’s students are at the official aid maximum thresholds and cannot see any increase in assistance.
Figure 8: Indexed Change in Total Real Provincial Loans and Grants Disbursed, British Columbia vs. Other 9 Provinces, 2011-12 to 2019-20 (2011-12 = 100)
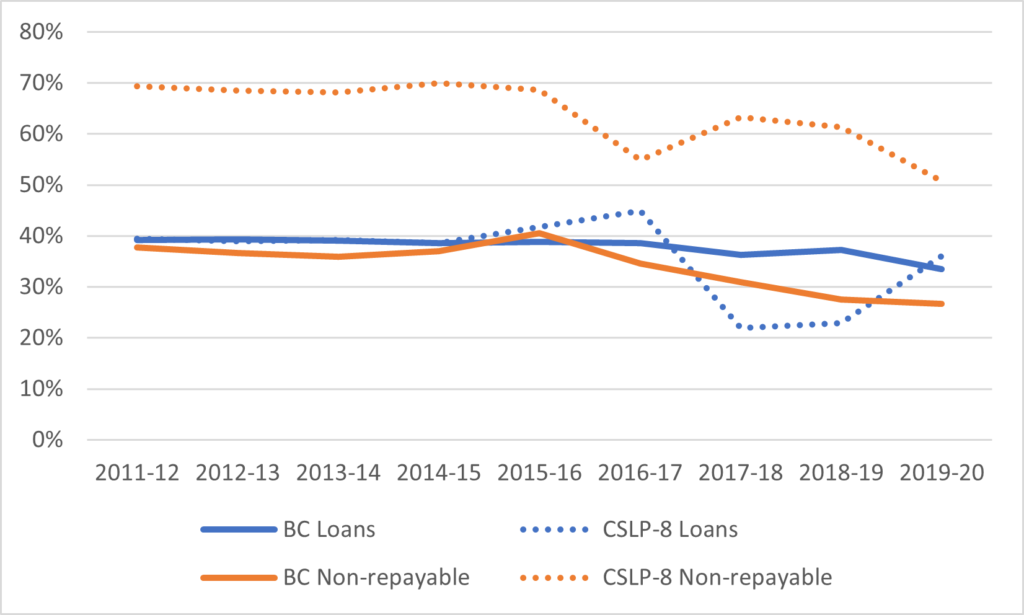
Finally, Figure 9 looks at how much of the province’s student assistance comes from provincial as opposed to federal sources. For this exercise, I compare British Columbia to the other eight provinces which participate in the Canada Student Loans Program, again excluding Quebec. What we see in this figure is that where grants are concerned, British Columbia contributes roughly the same proportion as other provinces; however, it issues a considerably smaller proportion of total loans than is the case in other provinces. On the one hand, this approach to loans means students incur less debt; on the other hand, it means there is less funding of all kinds available to students, some of whom at least might prefer to have access to more assistance in the short term even if it means more debt in the long term.
Figure 9: Provincially-Funded Loans and Grants Disbursed as a Percentage of Total Loans and Grants Disbursed, British Columbia vs. 8 other Canada Student Loans Program Provinces, 2011-12
So that’s a third province down, and we have a fair bit of provincial variation in approaches to funding and in terms of student enrolments, both foreign and domestic. Keeping track of these differences can help us understand the extent to which different provincial policies affect overall outcomes.
In any event: have a good weekend everyone.

 Tweet this post
