We promise fun bibliometric data, we deliver fun bibiometric data. Today: we show you how to use H-index data to identify the top ten science faculties in Canada.
As we saw yesterday, science has the highest average H-index of any field; the average Canadian science professor has an H-index of 10.6. Recall that the H-index is the largest number of publications for which one also has at least the same number of citations – five papers with at least five citations gives an H-index of five, etc. But average H-indexes can vary enormously from one discipline to another even within a broad field of study like “Science.” Math/stats and environmental science both have average H-indexes below seven, while in astronomy and astrophysics, the average is over 20. Simply counting and averaging professorial H-indexes at each institution would unduly favour those institutions which have a concentration in disciplines with more active publication cultures.
(This, by the way, is true of pretty much all research metrics out there; even research dollars per professor can be skewed by these kinds of differences. Only the Leiden Rankings do any kind of field normalization, though they do not do use the H-index.)
The way to get rid of this bias is to replace raw H-index values with “standardized H-index scores.” These are derived simply by dividing one’s H-index score by the disciplinary average. Thus, someone with an H-index of 10 in a discipline where the average H-index is 10 would have a standardized score of 1.0, whereas someone with the same score in a discipline with an average of 5 would have a standard score of 2.0. This permits more effective comparisons across diverse groups of scholars because it allows them to be scored on a common scale while at the same time taking their respective disciplinary cultures into account. What this means in practice is that if one wanted to compare, say, science faculties, one can simply field-normalize all the scores, and then average them across all faculty members.
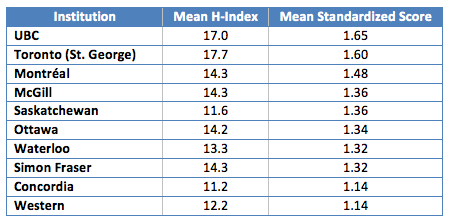
Our trusty database of over 60,000 faculty members allows us to easily do this for all of Canada’s science faculties. We find the top ten, in terms of concentration of scientific talent, to be as follows.
Just using a raw H-index, the University of Toronto comes first in part because it is better than UBC in some very high-citation disciplines like astrophysics. However, adjusting for disciplinary norms, UBC heads the list. Saskatchewan comes a surprising fifth in this list, thanks to strengths in environmental and earth sciences.
More tomorrow.


 Tweet this post

Can you share how you have attributed an individual faculty members publications over time (is there a specific time period used) to their current institution? For example, if faculty member A existed on Institution A’s website when you collected your faculty lists, but the majority of his/her publications came while he/she was a faculty member at Institution B, does Instiution A get to credit those publications?
Hi Kerry,
That’s correct – we don’t have a record of previous employment, and are only able to attribute individuals to their current institution. So in your example, faculty member A`s publications would all count towards institution A. We’ve been running with the idea that the value of publications is attached to the individual who wrote them, rather than the institution at which they were written. This approach means that, from a functional perspective, attracting established researchers is given the same weight as encouraging existing faculty to excel. If there is some way to identify where a publication was written it would certainly add a fascinating perspective on the latter!