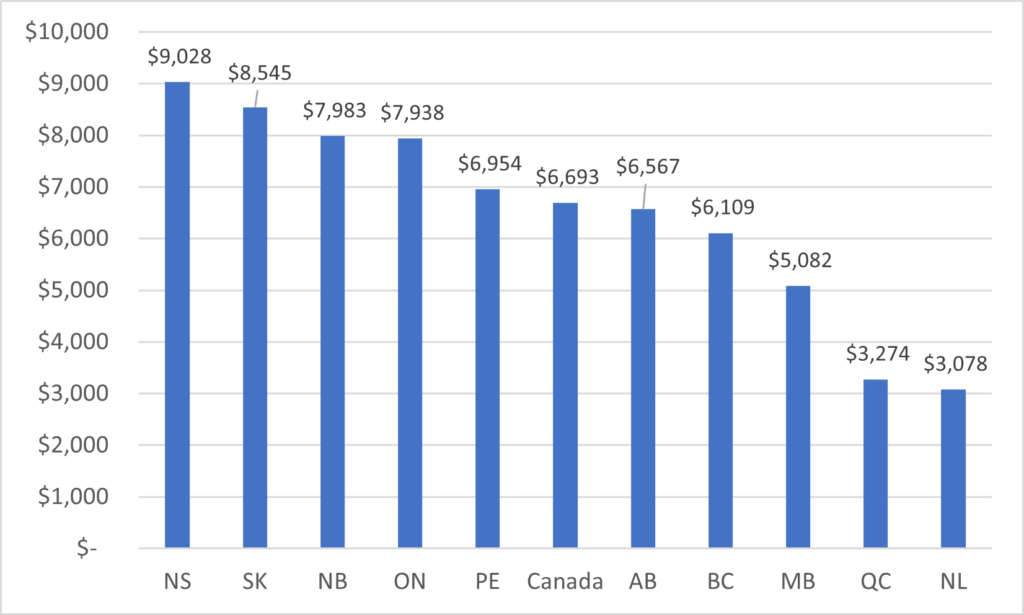
StatsCan released its annual survey of tuition fees at universities last month (it does not bother to collect similar data with colleges, because reasons). Average domestic undergraduate fees looked like this:
Figure 1: Average Undergraduate Tuition, by Province, 2021-22

Only two things to note here. First, Ontario fees keep falling relative to other provinces because of the Ford government’s freeze on tuition (for which, hilariously, it continues to receive no political credit). For most of the past decade, Ontario was reliably top of these charts, and now it has fallen to fourth. Meanwhile, Alberta is climbing towards the national average thanks to its recent hikes in tuition.
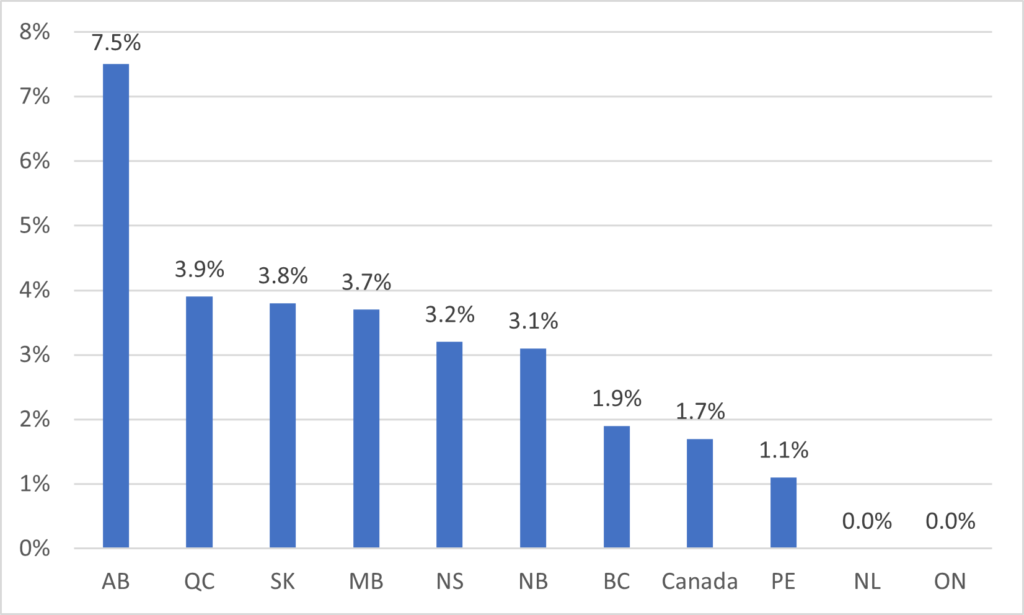
Of course, there’s another way to present the data. Tuition alarmists sometimes like to show the data according to the rise in the previous year, because that way sometimes even provinces with below-average tuition (e.g. Alberta) can be presented as “endangering affordability”. And indeed, this year Alberta’s tuition fee increase is a bit eye-watering at 7.5%, more than four times the national average of 1.7% (Ontario drags the average down a lot).

But however much some people wish it were otherwise, affordability is not price. It is, rather, about ability to pay. For any given good at any given price, some people will think it is affordable and others not, depending on the amount of money they have. And so it is with tuition. If you really want to examine “affordability” on a provincial basis, you would need to divide tuition by some kind of measure of income. Say, median family income for families where the respondent to StatsCan surveys is aged 45-54 (this is census data, so the years don’t line up exactly, but you get the idea).
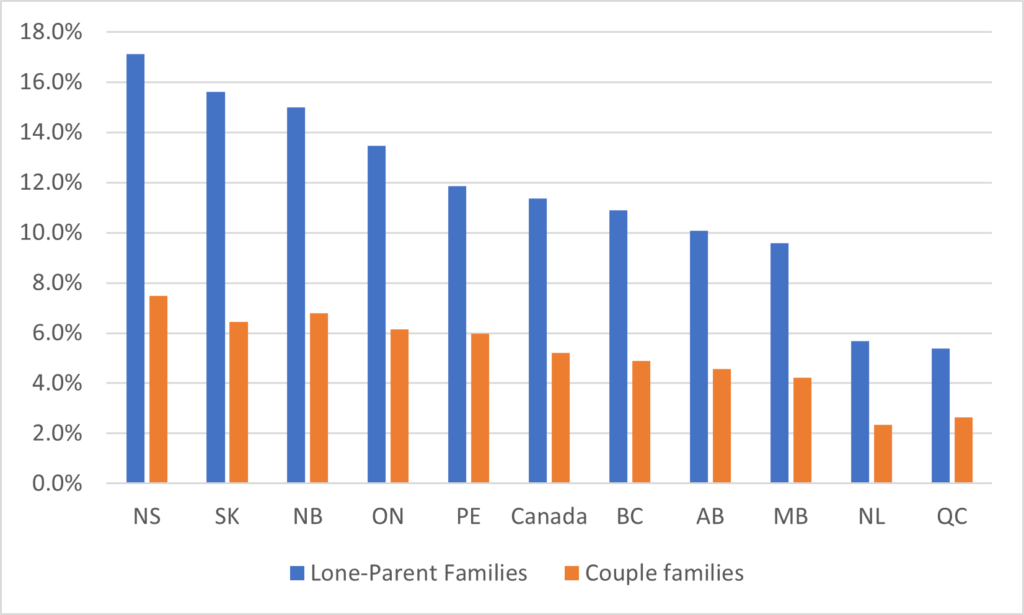
Figure 3: Tuition as a Percentage of Family Income, by Type of Family Age 45-54 and by Province

There isn’t a whole lot of difference between Figures 1 and 3 in terms of rank order. Ontario and Alberta look a little bit better, PEI and BC look a little worse, and Nova Scotia might be seen as a little hard done by here given how many of its domestic students come from Ontario. But at least it put tuition numbers into some kind of context about ability to pay. Of course, you could get higher numbers if you used smaller denominators (e.g. avg income of 20-24 year olds), and that would be fine, too. There are multiple ways of thinking about affordability, with the proviso that it always has to be a ratio.
But wait a minute, you may say. Aren’t you always talking about student aid and the importance of student aid and net price? If we are talking about affordability, shouldn’t we bring this aspect in as well? Well, this is tricky because a) not everyone gets student aid and b) Statistics Canada doesn’t collect data on student aid. However, if I plunge into the HESA Towers Treasury of Canadian Higher Education Data Statistics Canada Can’t Be Bothered To Collect or Put Online (HTTCHEDSCCBBTCPO, just rolls off the tongue), take total grants awarded, divide it by the number full-time equivalent post-secondary students in the province, subtract the result from the tuition figure and divide that by the family incomes, I can kind of work out what an affordability measure including student aid would look like. It’s a crude measure, but it takes us more or less in the right direction.
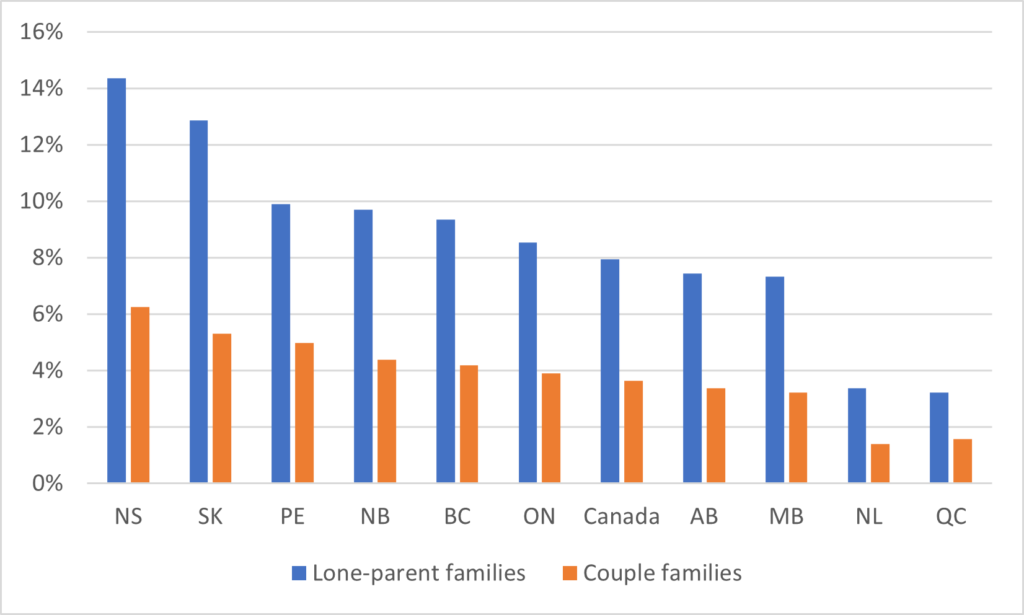
Anyways, if you do all that you get the result in Figure 4. Ontario looks better on this measure, PEI looks a little worse. The gap between Nova Scotia and Quebec/Newfoundland is wider on this measure is higher than it is just on a straight tuition measure. And overall, what you find is that nationally, the price of tuition (minus grants) is about 4% of median gross family income of the relevant age group, and 8% of that of lone-parent families.
Figure 4: Net Tuition as a Percentage of Family Income, by Type of Family Age 45-54 and by Province

Whether these numbers are too low or too high is a matter of opinion and, as I noted earlier, other denominators are certainly possible. But the point is, they are numbers which look at affordability the way it should be examined: as a ratio. Our debates about affordability would be much better if we could keep this notion firmly in mind.

 Tweet this post

In the case of PEI of course, if you’re an Islander there’s also the George Coles Bursary to take into account. $2200 a year for everyone