If there’s one common complaint among academic staff it’s that non-academic staff… administrators… are multiplying like weeds, and taking over the university. Of course, no one can tell if this is actually happening because Canadian universities have never bothered to put together any common statistics on non-academic staff.
What we do have, though, is data on non-academic staff compensation – that is, we can see how much non-academic staff were paid in any given year, and track that over time. We can then compare that to how much money was spent on academics. These changes in compensation ratios are a reasonable indicator of changes in staffing levels, even if we don’t know exactly how many people are employed in these positions.
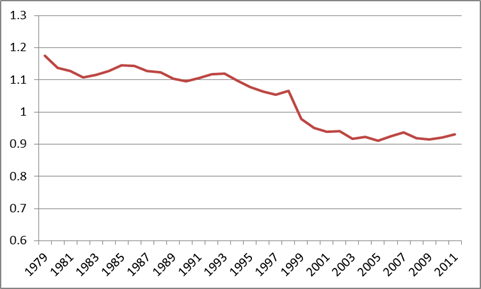
Going back to 1979, the ratio of academic to non-academic staff compensation looks like this:
Figure 1: Ratio of Academic to Non-Academic Staff Compensation, 1979-2011
Source: CAUBO/Statscan Financial Information of Universities and Colleges Survey
What Figure 1 means is that, whereas in 1979, total academic salary mass was 17% higher than non-academic salary mass, by 2011, it was 7% lower. Interestingly, there’s actually been no change at all in the past decade: the ratios have remained essentially stable since about 2000. Before that, they fell gradually for about 20 years (the apparent huge fall in 1999 was the result of a change in the survey that – as I understand it – brought academic salary mass more fully into the picture, which obviously would have a negative effect on these ratios. So in fact, about a third of the change seen here is actually just the result of a series break).
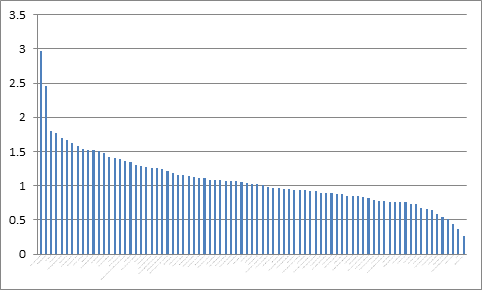
Of course, averages are one thing – but they can hide a heck of a lot of variation between institutions. Here’s the distribution of non-academic to academic salary masses for 2011, across all institutions:
Figure 2: Distribution of Academic : Non-Academic Salary Mass Ratios by Institution, 2011
Source: CAUBO/Statscan Financial Information of Universities and Colleges Survey
In fact, a majority of institutions still have ratios above 1.0 (meaning they spend more on academic staff than on non-academic staff); it’s just that some of the country’s biggest institutions have ratios below 0.9, and they drag the average down considerably.
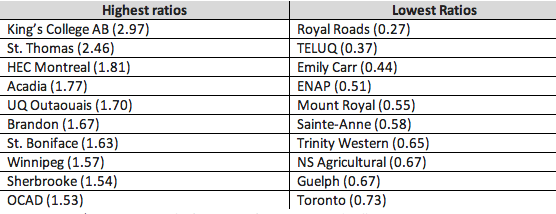
But that’s still not quite the whole story. Take a look at the top and bottom ten institutions on this measure:
Table 1: Top and Bottom Ten Institutions Based on Academic : Non-Academic Staff Salary Mass Ratios
Source: CAUBO/Statscan Financial Information of Universities and Colleges Survey
Looking at the left-hand column, the secret to spending less on non-academic staff seems simple: just be a small institution with no major science programs (Sherbrooke is an anomaly). That makes intuitive sense if your hypothesis is that the big contributor to the growth in non-academic salaries is the growth of universities’ research function. The problem is, a lot of very similar universities are also in the right-hand column. Ste. Anne and Emily Carr are practically identical to St. Boniface and OCAD – so why the enormous differences? Royal Roads’ and TELUQ’s low ratios are easy to understand because of their reliance on IT – so too is Toronto, with its enormous research overheads. But ENAP? Trinity Western? What’s going on there?
The answer is, we don’t know. Much of the U-15 universities tend to cluster between .95-.75 on this measure, but apart from that, there doesn’t seem to be a lot of rhyme or reason to how much institutions spend on academics vs. non-academics. And yet it has a pretty big effect on institutions’ bottom lines. It’s a puzzle worth trying to solve.


 Tweet this post

Thanks for this – This is certainly a black box. Although at my institution they do provide the standard annual budget figures, there seems to be a bit of shorthand going on where certain items, such as bulk admin salaries, are simply spread out and then rolled into office expenditures. But the budgetary picture is even more complex than this. I’m seeing some universities deciding to just erect new buildings rather than fix the older ones, and gunning for expansion [spatially and in terms of enrolment] while completely ignoring the coming precipitous drop in enrolment due to just basic demographics – and the big dream of courting international students to make up for the shortfall is not going to pay off for unis outside of major urban centres. Fuzzy up this picture a bit more in terms of where the money is going in salary terms. Western, for example, has the highest paid uni president in Canada, but not many are really sure why; meanwhile in the trenches, over half the courses are taught by part-timers. The magic trick here is to find real data on the actual faculty complement to better compute the academic labour side of the equation. Good luck on that, of course, because that’s another black box. The best I could get for my own data munch came to me in what pretty much amounted to a kind of unmarked manila envelope dropped on my doorstep at midnight sort of thing. Simply reading through publicly available uni budgets leaves one wanting a bit finer of a grain.
Many good points here. One quibble: in fact, some of the biggest international student #s can be found in smaller centres. %-wise, the #1 school in Canada for int. students is Cape Breton U – over 30%.
*slaps forehead* … Looking at my data, you are absolutely right in re: int’l student % at smaller schools. CBU is a top example.
As you note, we do not really understand why administration has grown since the 1990s, but I suspect that reliance on IT in combination with the increased requirements for audit, risk management, and compliance are more important than science programs and research capacity in explaining the changes. That does not explain the different ratios at various institutions, but it does help explain the increase in non-academic staff over the last two decades.
I agree that the increase has a lot do with the growth in IT and other infrastructure support, and in compliance requirements – at least that is the case in Australia. Overall, the world has become more complex, and more people with more skills are needed to do stuff than used to be the case.
I think that admin salaries are sometimes combined with faculty salaries so that it makes things confusing. A dean, for example, has a faculty component and an admin component to his/her salary. So this could inflate the faculty salary line and decrease the admin salary line, even though this dean may not do any teaching or research.
Deans are counted as faculty, as far as I know. So, yes, to the extent that Deans don;t teach, it’s true it would affect the split between the two types of spending. unlikely it would affect the trend, though, isn’t it?
If there are more deans (and deanlings and deanlets) — and their salaries and benefits are included in the faculty line – this could certainly affect the trends. Would be nice to have the proper data to have a better look at these trends.
I suspect the growth here (which might more plausibly affect the trend) isn’t so much deanlings and deanlets, but associate VPs coming from the Faculty ranks. Any idea, Alex, whether your data would categorize the salary of a professor working as an AVP on the admin side, the Faculty side or a bit of both?
Robert Irwin’s point about IT, audit, risk mgt and compliance seems bang-on to me…
As I understand the rules, if they have teaching responsibilities, they’re under faculty. If they don’t they aren’t.
When I click on Fig. 2, it reopens at the same size – but still too small to see the labels on the horizontal axis. Any chance of providing a higher-res version?