Last week Statistics Canada came out with a damn good paper on post-secondary access and persistence which I thought was worth highlighting. The paper is called Enrollment and Persistence in Postsecondary Education Among High School Graduates in British Columbia: A Focus on Special Needs Students, and it was written by Allison Leanage and Rubab Arim. It was made possible by linking together two databases: the Post-Secondary Student Information System (PSIS), which contains unit-record data on all post-secondary students in Canada and can be used to follow students longitudinally through the system, and data from the BC Ministry of Education K-12 data system.
Canada has typically had trouble measuring the transition rate or the access rate: that is, the percentage of students which go on from one level of education to another, is traditionally quite difficult to measure. Statscan can’t do it alone: it has unit-level data on post-secondary students but not on secondary ones which means in effect it does not know who doesn’t go on to post-secondary (which is kind of important if you want to understand access)
The other really interesting aspect of this piece, is that by using K-12 data, we can to some degree compare outcomes across groups of students that have been identified by the secondary system as having different “need”. This includes “gifted” students, students with physical or sensory disabilities, and students with some kind of mental health or cognitive needs. Students not falling into any of these categories are called the “reference group.”
The most basic data provided in this report is the transition rate: what percentage of British Columbia high-school completers go on to some form of higher education? The paper actually breaks out this data separately for all cohorts between 2010-11 and 2014-15, which makes the tables kind of annoying to wade through. For the purposes of this blog, I default to using the 2010-11, to provide the greatest number of years of observation (the data does not vary much from year-to-year).
As Figure 1 shows, the transition rates for this group—which makes up over 90% of the whole sample—are over 80% for both men and women (with the figures ever-so-slightly higher for women than men). Just over six out of ten (50%+ of total) do so immediately after high school; the rest delay their entry somewhat.
Figure 1: Transition-to-PSE Rates for High School Graduates in BC for Reference Group students, 2010-11 Cohort
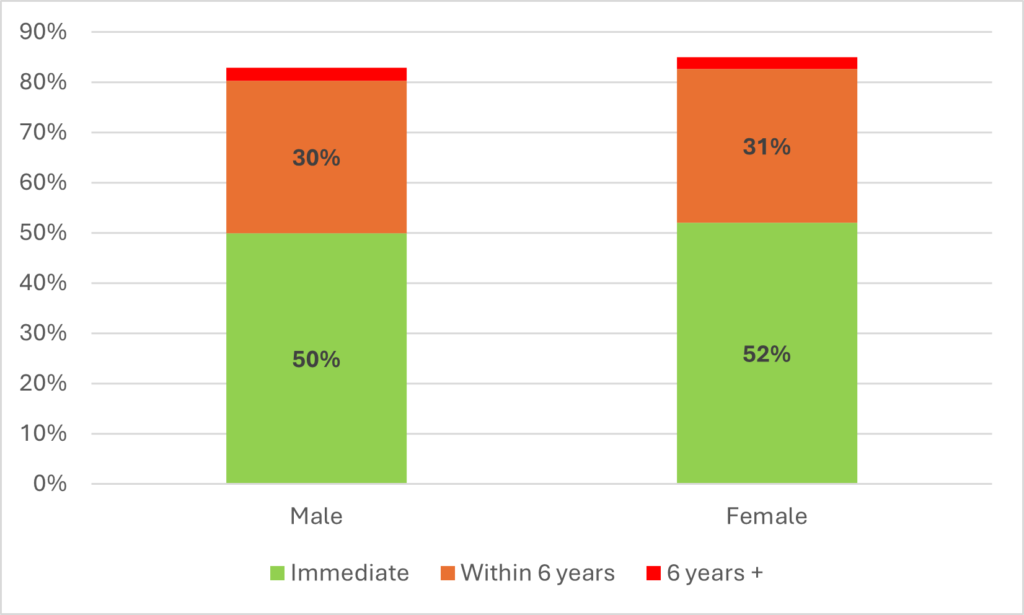
Figure 2 shows the same data but for “gifted” students. This is the one group where the transition rates are higher for men than women. Together across both genders, the overall transition rates are 8-10 percentage points higher than they are for the reference group.
Figure 2: Transition-to-PSE Rates for High School Graduates in BC for “Gifted” students, 2010-11 Cohort
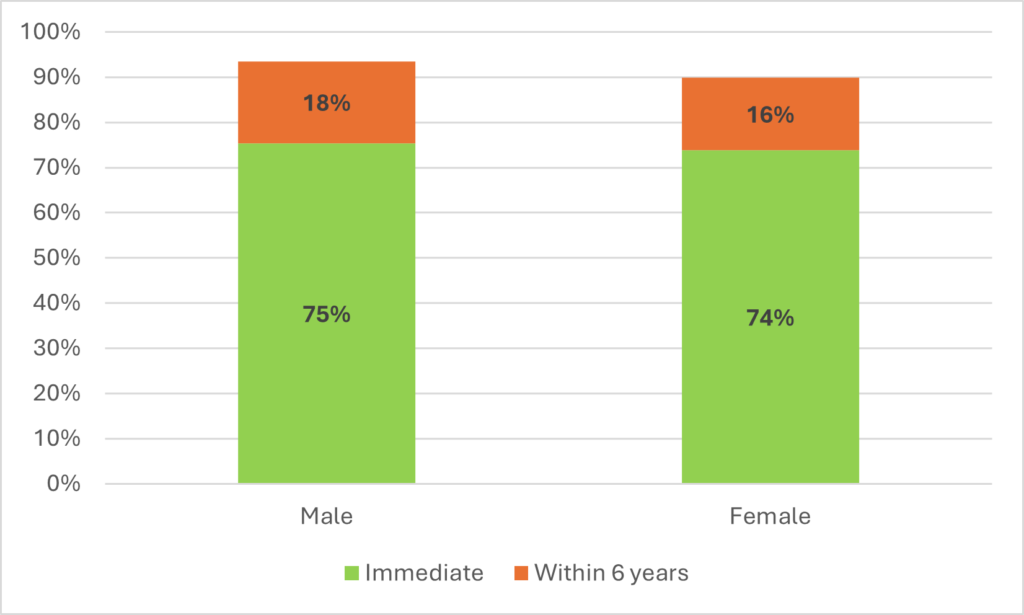
Figure 3 shows the transition rates for high school graduates with physical or sensory needs. These students, it turns out, are actually slightly more likely to make an immediate transition to post-secondary education than the reference group, though very slightly less likely to go overall.
Figure 3: Transition-to-PSE Rates for High School Graduates in BC for Students with Physical/Sensory Needs, 2010-11 Cohort
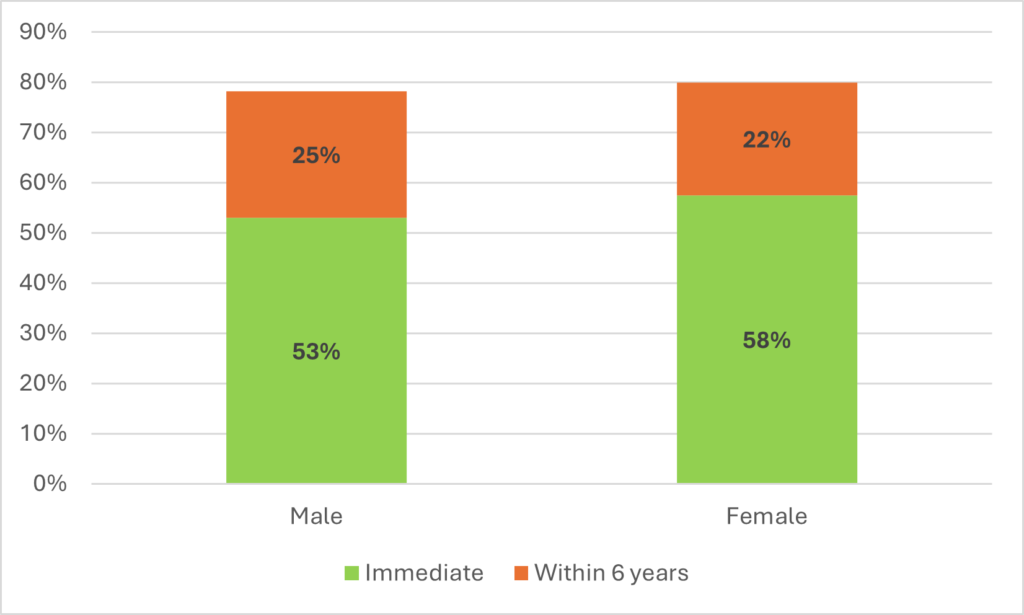
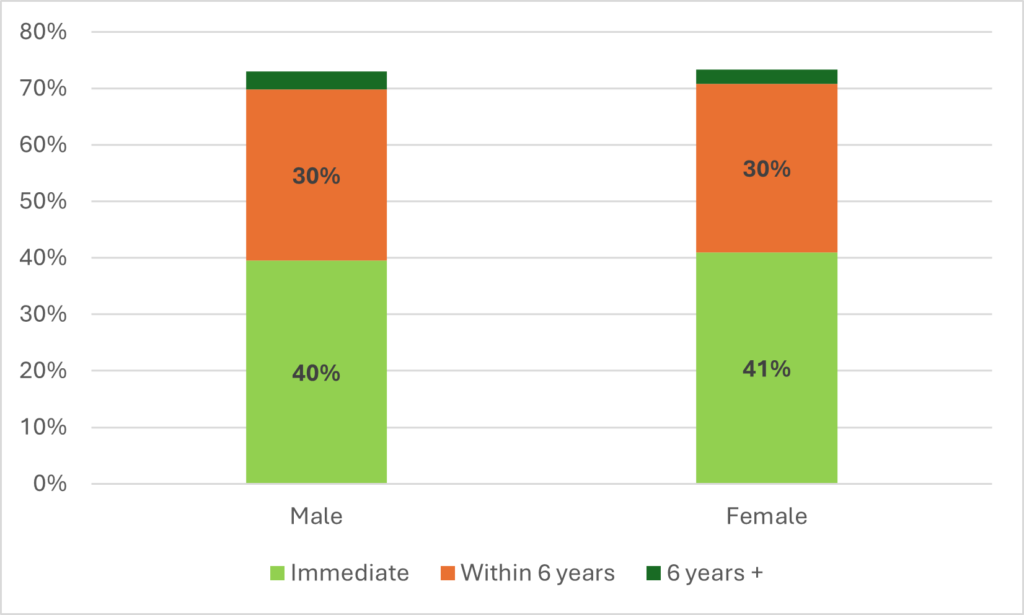
Figure 4 shows the transition rates for students with Mental Health and Cognitive needs. Here the transition patterns are about ten percent lower than for the reference group, with nearly all the difference being accounted for by a reduction in the percentage who attend directly from high school.
Figure 4: Transition-to-PSE Rates for High School Graduates in BC for Students with Mental Health and Cognitive Needs, 2010-11 Cohort
Now, Figure 5 shows what type of credential different groups of students choose to pursue. These figures, which are also for the 2010-11 cohort are somewhat strange because while the pattern they show is similar to figures 1-4, the exact percentages are somewhat higher, for reasons that are not made clear in the text. The patterns, however, are similar, so I think we can trust the basic thrust of the argument here which is as follows: “gifted” students are much more likely to enroll in university undergraduate programs than the reference population, which in turn is more likely to enroll in university undergraduate programs than either the population with physical/sensory needs to with mental health/cognitive needs. This of course has some pretty significant implications for the distribution of different kinds of student services across different institutions.
Figure 5: Transitions to PSE by Type of Credential Pursued, 2010-11 Cohort
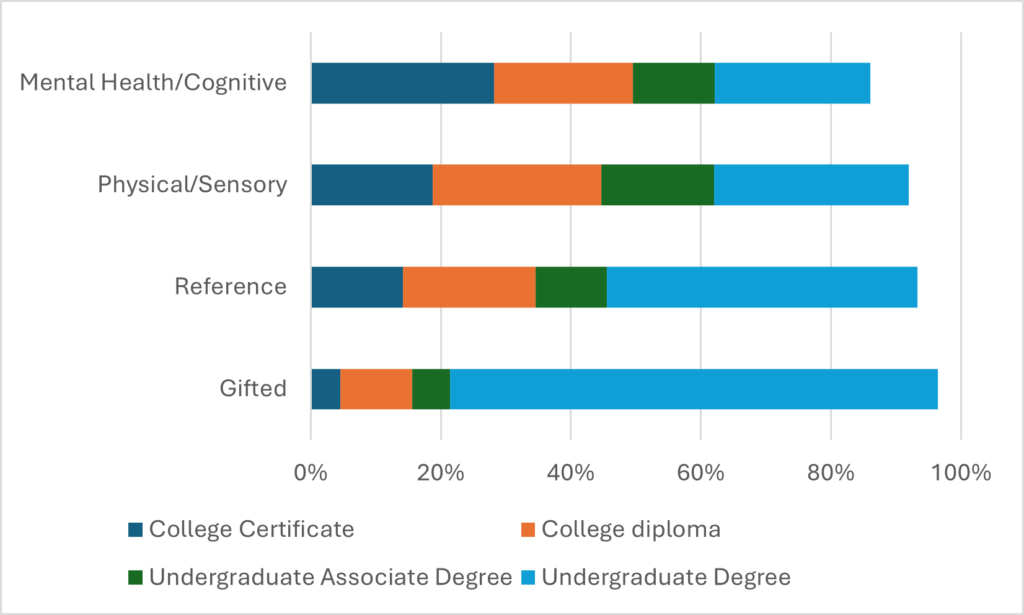
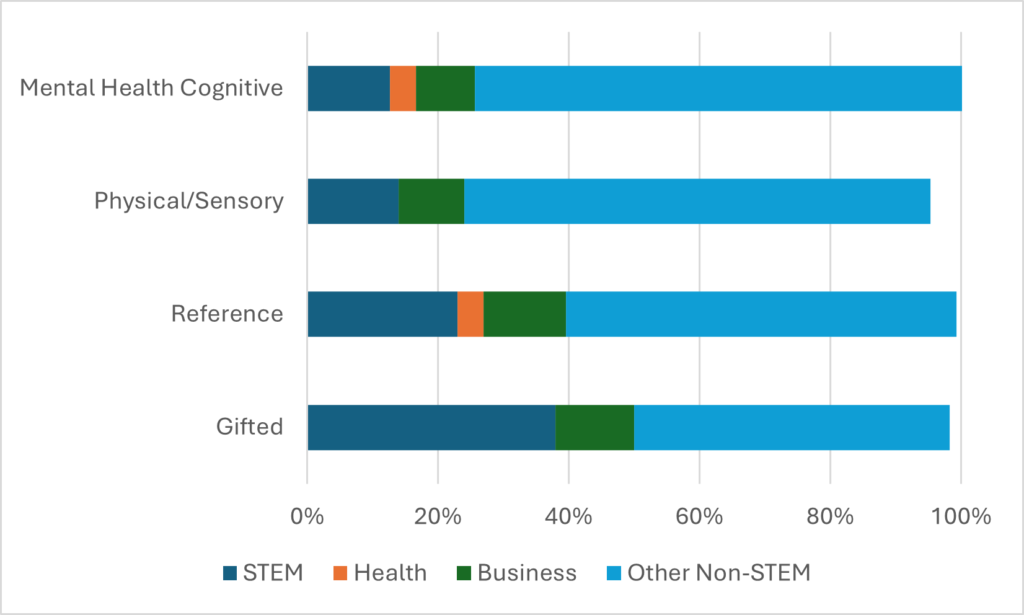
Figure 6 shows what kinds of programs students from each background attended. Again, there is something wonky on the numbers: it looks like this is simply the distribution of those who attendpost-secondary, so it is out of 100%, only the numbers don’t quite add up. But again, we’re seeing a similar pattern in the data here: “gifted” students are much more likely to enroll in a STEM program than reference group students who in turn are more likely to study STEM than students with various types of physical/sensory or mental health/cognitive needs. See a pattern here?
Figure 6: Transitions to PSE by Type of Program, 2010-11 Cohort
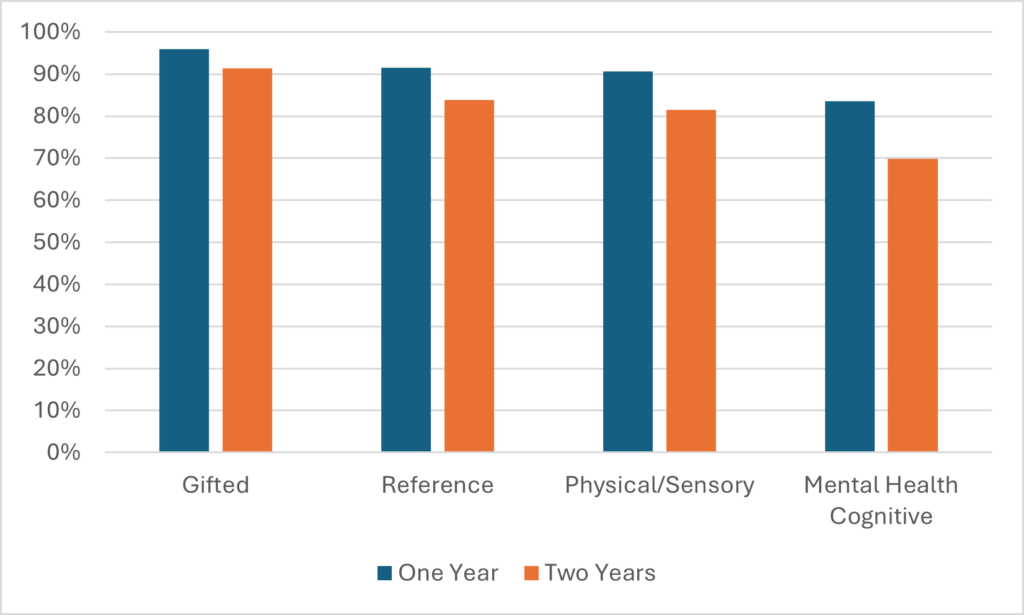
Finally, beyond access there is the question of persistence. Again, rates are highest for gifted students, somewhat lower for the reference group and students with physical/sensory needs, and then lower again—substantially—for those with mental health or cognitive needs. The pattern holds true across both the 1-year and 2-year horizons.
Figure 7: One- and Two-year Persistence Rates by Student Type, 2010-11 Cohort
I want to highlight just one or two things in conclusion. The first, obviously, is that there are disparities in rates of access and persistence in post-secondary education according to secondary school special need status. But the second is: for the most part they actually aren’t that large. In particular, the access and persistence rates of students with physical and sensory needs is almost identical to those of the reference group. And third is: overall, these rates of access and persistence are really high. Big picture, this is evidence of success. That said, the stratification of enrolments by program and credential type is a bit concerning, and worthy of further study and attempts at policy change.
Anyways, this is a good paper. Similar papers could be written in every province if provincial authorities could get their act together and link their data to Statistics Canada’s. Ontario, in particular, has a great K-12 database but has made it almost impossible for anyone to actually use. Much could be learned, much progress could be made, if we had the slightest interest in using data properly, to achieve important policy objectives. But apparently we don’t.
I’d like to think this paper will be the first of many. More likely, it will stand as an outlier. But it’s a good outlier: congrats to the authors, this paper deserves both to be widely read and widely imitated.

 Tweet this post
