While the debt burden current students and recent graduates face may not be as difficult as aggregate student debt levels might suggest, there’s one final point worth making about student debt in Canada.
As we reported, student debt levels in the 2000s increased somewhat, but not as much as you might have thought. Notably, university debt didn’t keep pace with increases in tuition, likely owing to significant federal and provincial investments in student grant programs. Yet averages tend to obscure outliers. And there’s a major outlier when it comes to Canadian student debt: the Maritimes.
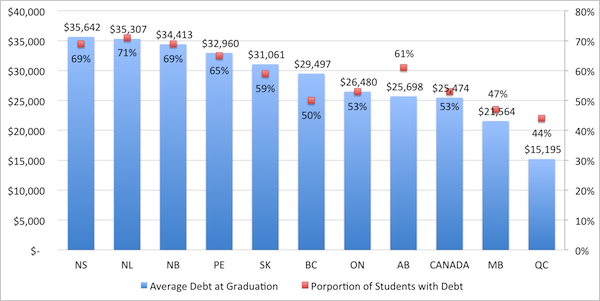
As Figure 1 indicates, the four provinces with the highest average student debt in Canada and the highest incidence of debt at graduation are in Atlantic Canada (Alberta being something of an outlier as far as the proportion of students with debt goes).
Figure 1: Incidence and Average Amount of Undergraduate Debt at Graduation in 2005, by Province (in 2011 Dollars)
 Source: Statistics Canada’s National Graduates Survey
Seven in ten undergraduates in Nova Scotia, Newfoundland and Labrador, and New Brunswick completed their studies with an average of more than $34,000 in student debt in 2005. Figures from the 2009 Canadian University Survey Consortium survey of graduating students make clear that debt loads in Atlantic Canada remain higher than everywhere else.
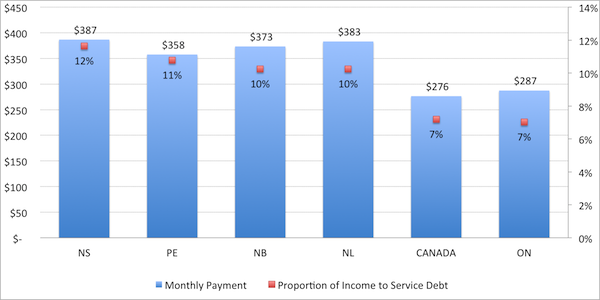
So while the “average” Canadian university student graduates with about $25,000 in debt, the situation in the east is quite different – debt loads in the four Atlantic provinces are 25% to 35% larger than those in Ontario, which is (as usual) very close to the national average. Figure 2 looks at monthly student loan repayment amounts in select provinces, using current interest rates and debt figures from 2005; it also shows the percentage of income a student would have to devote to debt servicing.
Figure 2: Average Monthly Student Loan Payments, Class of 2005, in Select Provinces, and Proportion of Before-Tax Income Required to Service Debt (in 2011 Dollars)

Source: Statistics Canada’s National Graduates Survey, 2006 Census, CSLP Repayment Calculator and Author’s Calculations
A graduate in Nova Scotia would owe $100 more per month in Canada Student Loan payments than a graduate in Ontario. Moreover, because incomes are lower in the three Maritime provinces are below the national average, students graduates there face a double whammy: they owe more in student debt and they earn less to service that debt.
Once you consider the taxes graduates have to pay, those in eastern Canada are likely to be devoting too much of their income to debt payments. As we’ve written in the past, the economists Saul Schwartz and Sandy Baum have established a sliding scale of reasonable debt payments. The average graduate with debt in Atlantic Canada – not those at the extreme end of the distribution – is pretty close to failing the Schwartz-Baum stress test. By any measure, the student debt situation in Atlantic Canada is simply dangerous.

 Tweet this post

The average undergraduate debt at graduation is actually much smaller than depicted in the charts and discussed in the text. This analysis is actually about those students who have debt when they graduate; many do not. Excluding them from the average is a favorite tactic of the CFS which Joseph has fallen for.
Brian, that’s why I included the incidence of debt. You’re right in that the title of the chart should be make that clear. That said, I wouldn’t call it a CFS “tactic.” If you’re a policymaker looking at ways of managing the student debt burden, don’t you want a figure with all the zeros removed? Interestingly, if you include all those with $0 in debt in Nova Scotia, the average debt clocks in at $24,592, higher than the national average for just those with debt.