A few months ago, we reported that increases in student debt in the 2000s did not keep up with tuition, owing largely to increases in student grant and bursary programs.
Yet the raw amount of student debt at graduation tells only part of the story. Thinking about debt in terms of balance owing can obscure more than it reveals; it’s also worth looking at debt from the lens of monthly student loan payments.
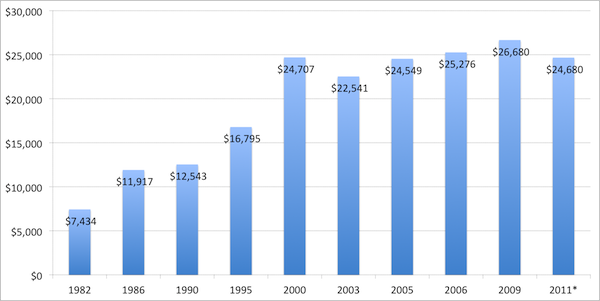
Given student loans’ fixed repayment period, monthly loan payments are based on just two things: the principal (the amount of debt at graduation) and the interest rate. Figure 1 provides the debt at graduation over time. Debt rose rapidly in the 1990s when loans were rising quickly and grant programs were being dismantled, but since then has stayed fairly steady. The most recent publicly-available data dates from 2009; to generate a figure for 2011, we have assumed a decrease in nominal debt of 4% based on observed changes in government aggregate lending over that time.
Figure 1: Average Debt Among Borrowers at Graduation in Canada for Bachelor’s Degree Graduates, 1982-2009 (in 2009 dollars)

Source: Statistics Canada’s National Graduate Surveys, Canadian University Survey Consortium Graduating Student Surveys
Interest rates on Canadian student loan programs are set by tacking a premium onto the prime rate. Between 1982 and 1990, CSLP charged interest of prime plus 1%; from 1995 onwards, it charged prime plus 2.5% (this is for a variable repayment rate; CSLP also offers a fixed rate of prime plus 5% that is much higher and, therefore, less frequently selected by students). A number of provincial programs offer lower interest rates; Ontario, for instance, charges just prime plus 1%. To keep things simple, we’ll use the higher CSL rate – just keep in mind that the figures we report below are, as a result, slight overestimates.
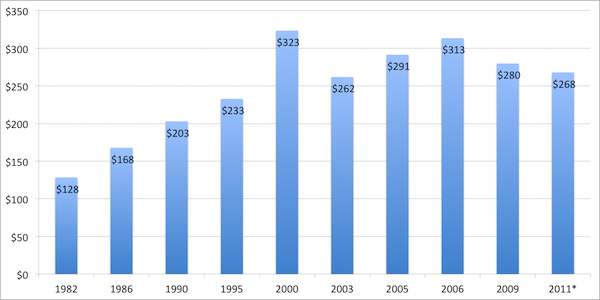
Now, while debt has been rising over the past few decades, interest rates have been falling. In the eighties, prime was consistently over 10%, while in the nineties it was mostly in the 7-10% range. Since 2000, as often as not it’s been below 5% and currently it’s bumping along around 3%. The resulting effect on student loan payments can be seen in Figure 2.
Figure 2: Monthly Student Loan Payments in Canada, 1982 to 2011 (in 2009 dollars)

Source: Statistics Canada’s National Graduate Surveys, Canadian University Survey Consortium Graduating Student Surveys, CanLearn.ca repayment calculator, Bank of Canada
In other words, student loan burdens have been stable for over a decade and are even down slightly over the past five years thanks to the Bank of Canada’s recession-fighting policies. In fact, the average monthly payment is down 15% since 2006.
It’s easy to think of student debt as a single figure – the amount owing at graduation. And with inflation, that figure is always going to be rising. But a more nuanced approach tells a different – and less sensationalist – story.
Of course, an even more nuanced approach would also take into consideration graduates’ ability to pay. More on that next time.

 Tweet this post

Interesting picture. Are you also going to look at the proportion of those graduating who have gone into debt?
We’ll be looking more closely at the financial situation of graduates, though there are numbers out there regarding incidence of debt at graduation. As you can see here (http://qspace.library.queensu.ca/bitstream/1974/5780/1/POKVol4_EN.pdf, p. 185), the percentage of university graduates with debt (all sources) increased slightly in the 2000s. Using one survey, it went from 56% to 58%. Using another source, we can see that debt decreased from 56% to 54% between 2000 and 2005.
This earlier document (http://qspace.library.queensu.ca/bitstream/1974/5782/1/Price_of_Knowledge-2004.pdf, p. 282) shows the incidence of debt in the 1980s and 1990s at below 50%, hovering around 45%.
An interesting graph would look at monthly loan payments as a percentage of median income a year after graduation.
The term student debt seems to include bank debt and student loan debt in the Price of Knowledge. Does bank debt refer to lines of credit and loans only, or also include credit card debt?
Agree with Spencer. Student debt payments after graduation as a percentage of median income would reveal an important piece of this story.
Thanks, Spencer and Connie.
On Monday we’ll look at loan payments as a percentage of income, though the data on graduate earnings by age and education level aren’t great, especially beyond 2005.
As for sources of debt, the NGS data includes debt from all sources, as does the CUSC data. That said, it’s “education-related” debt and likely not credit card debt, unless students reported credit card debt in one of the categories available to them. So: government, bank loans, lines of credit, family loans, etc., that are education-related: in. Credit card balance: out.