Co-authored with Tiffany MacLennan
Yesterday, Tiffany MacLennan and I took a look at Canadian survey data on student finances over the past 20 years. Today, we want to take a look at some of the data about their living arrangements and their social lives over the same period. If you haven’t read yesterday’s piece and want to know more about the data’s provenance and some caveats that go with it, click on that link and then come back.
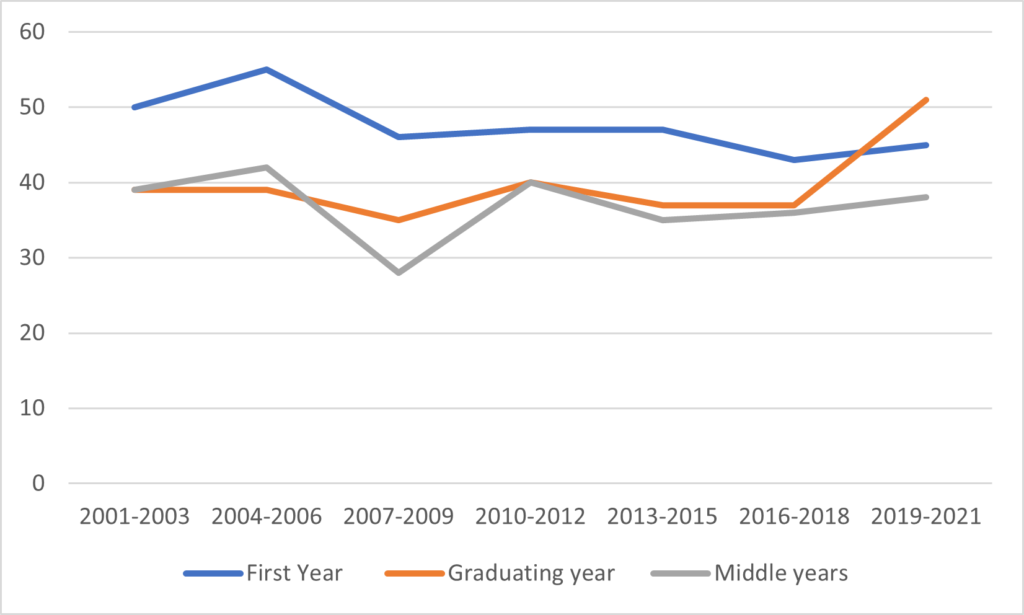
Let’s start with living arrangements. Unlike some countries, Canadian undergraduates tend to stick close to home, with only about 8% leaving their home province to study. In fact, on the whole, most take their post-secondary studies in the city in which they resided as secondary students. Therefore, it should not come as a shock that a majority of first-year students live at home with their parents. However, as they get older, some of them want more independence and move out. As Figure 1 shows, this mostly happens in the first year or two after the start of undergraduate studies. This seems to be a pretty consistent pattern, at least until 2021, when COVID dramatically changed students’ living arrangements.
Figure 1: Percentage of Students Living at Home With Parents, 2001-03 to 2019-21 Survey Cycles

The CUSC surveys ask a lot of interesting questions about student participation in various activities such as volunteering, attending campus events and student clubs but unfortunately absolutely none of them are usable for time series analysis either because the wording of the question changed over time, or because of changes in the same frame (i.e. when the “all years” survey became just the “middle years” survey – this shift doesn’t always matter but participation patterns do change a lot by year of study so in this instance it make a real difference). This is unfortunate because this kind of information gives us a sense of how students choose to make friends and more generally what the “extra-curricular” portion of students’ education looks like.
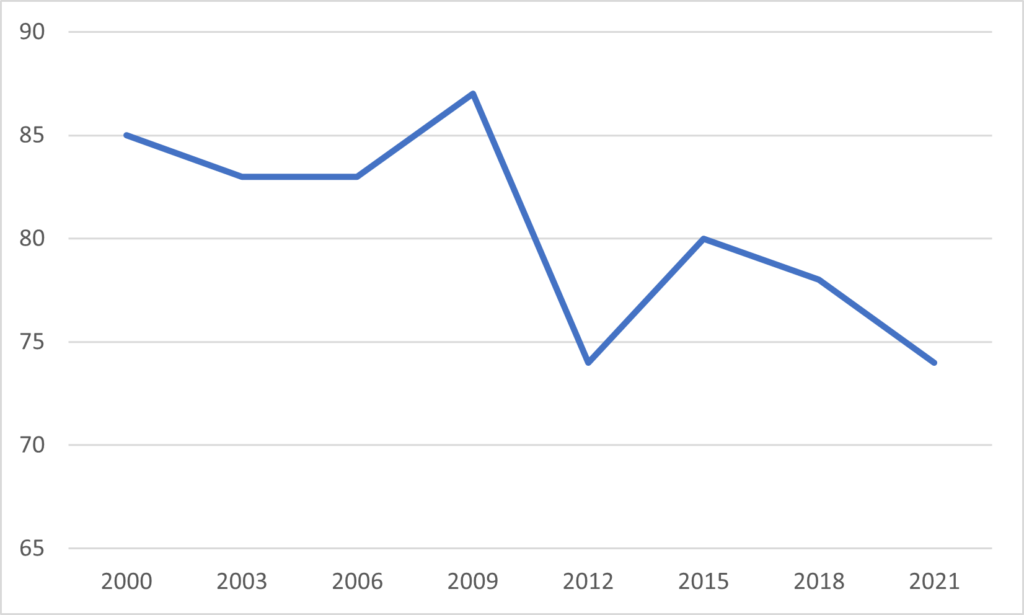
There is, however, a proxy for the student relationships part of the equation. The graduating student survey has asked students since 2001 about the “level of satisfaction with your opportunities to develop lasting friendships”. This number bounces around a bit from survey to survey, but the general tendency is downwards, perhaps suggesting a somewhat more atomized student body.
Figure 2: Percentage of Students Indicating They Were “Satisfied” or “Very Satisfied” With Their Opportunities to Develop Lasting Friendships

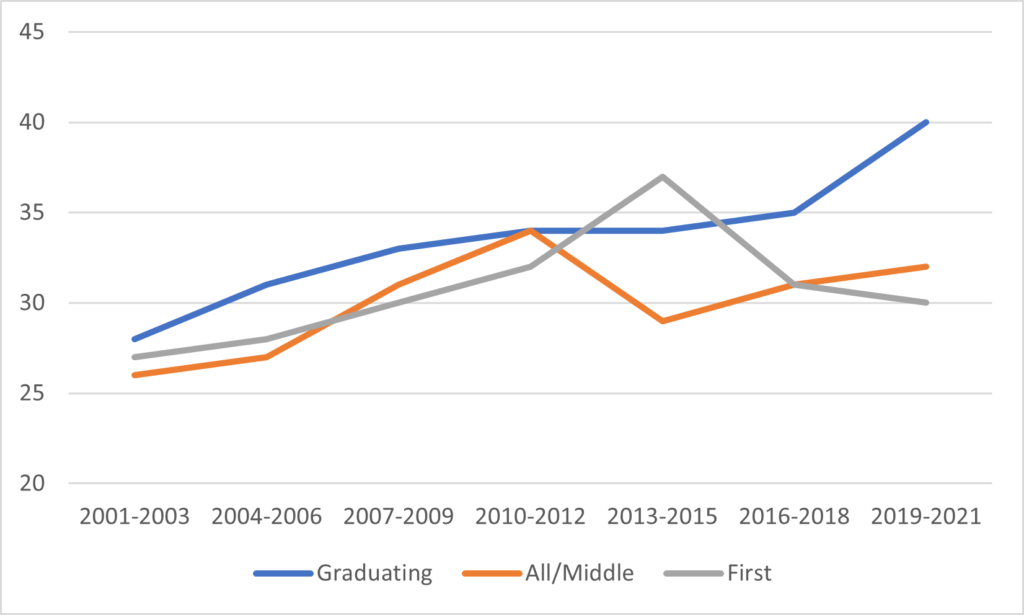
The data quality on the academic side is significantly better. Of particular interest is the data on grades, which seem to be rising over time. The data is a little bit choppy for the first-year and all/middle years surveys, but in both cases, the percentage of students saying they received A grads has risen slightly over the past 20 years. For the graduating students, the data is less ambiguous and the growth is stronger. It is not clear whether this change is because there is a generalized rise in academic grades across all institutions, or if it is due to the shift over time in CUSC membership away from research-intensive universities and towards relatively small institutions. But in either case it is something to be aware of and possibly to be investigated more thoroughly.
Figure 3: Percentage of Students Reporting having an Overall Average Grade of A-, A or A+, 2001-2003 to 2019-2021 Survey Cycles.

(and yes, it’s self-reported data and henceforth not as reliable as admin data – and while that might mean that A grades are over-reported, there’s no obvious reason why it would mean data would become more over-reported over time).
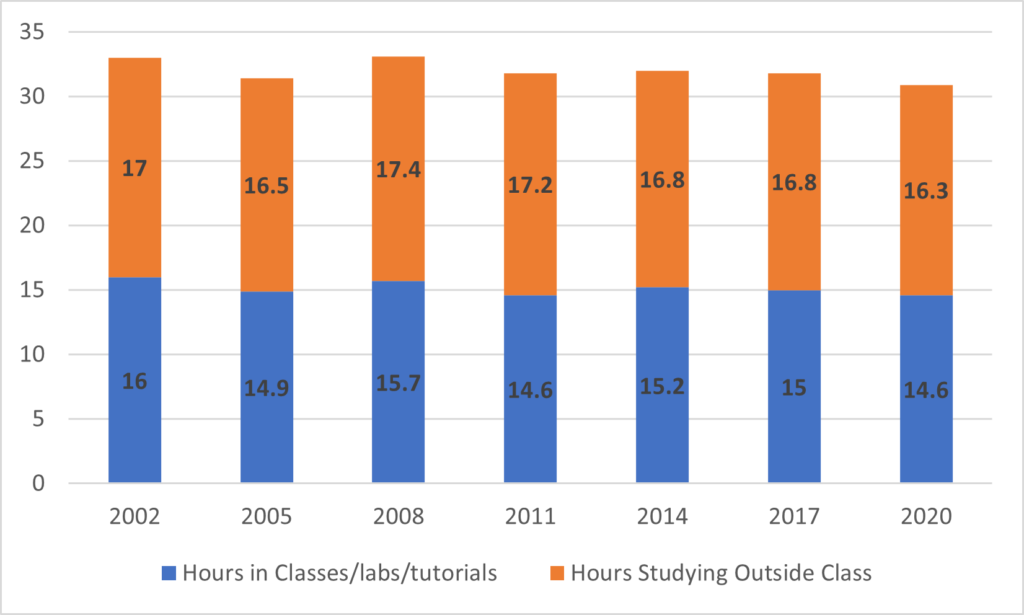
Finally, one of the most interesting time series in the CUSC data are the questions on time use. This question was in some of the earliest surveys of “all students” from 2002, continued on when that survey switched to being a “middle-years survey” and there was almost no difference in results between the two, suggesting that on this question at least “middle years” is probably a reasonable proxy for the entire student body. As Figure 4 shows, the amount of time that students report spending on academic activities has barely changed over the past twenty years. For every hour spent in class (or labs or tutorials), on average students report spending one hour outside class studying, or writing papers or laboratory reports. There is not really a trend to speak of here, with total hours bouncing around between 31 and 33 hours per week total spent on academic activities.
Figure 4: Number of Hours Per Week Spent in Academic Activities, 2002-2020

Anyways, if you are interested in seeing more of this data I recommend taking a wander through the CUSC back-catalogue of reports here: some of the questions about email use and the importance of wireless on campus from the early are kind of priceless as period pieces.
It’s helpful to have national data on students. I wish more institutions participated in this effort. I wish our national statistics agency and ESDC would see the value of funding such an effort. In the absence of either of those things, we just wish to salute the twenty-five years of work the volunteer group at CUSC have done over the years putting together a product which isn’t perfect, but is still the best thing out there with which to understand the student body on a Pan-Canadian basis. Gracias, amigos.

 Tweet this post
