


Today is World Access to Higher Education Day, and I thought it would be fun to use the occasion to celebrate the massive expansion of higher education that has occurred in the last decade and a half, while suggesting some reasons why the expansion may be running out of steam.
Before we begin: all the data in this comes from HESA’s forthcoming publication: World Higher Education: Institutions, Students and Finances, which is scheduled for release January 25th, 2022. It is – let me just say this – unbelievably good, thanks to the work of the lead author Jonathan Williams. What we’ll be looking at today is not enrolments, but enrolment rates, and specifically what are known as “Gross Enrolment Rates” or GER. This just means total enrolments (of whatever age) divided by some measure of population: some publications like to use 18-21, others 18-24: we use 20-24 mainly because it’s the age bracket closest to traditional university age where there is decent publicly-available data (thank you, United Nations!). You would certainly get slightly different numbers if you chose a different denominator, but the overall picture would remain pretty much the same.
Ready? Here we go.
Figure 1 shows you the big picture. Worldwide, from 2006 to 2018, the world added about 5.5 million students every year. This incredible expansion, plus decelerating demographic growth in much of the world, pushed worldwide GER from 28% to 43% in just 13 years, which is by any definition pretty incredible. Most of the growth happened in what we call the global South – that is, Latin America, Africa, and the bulk of Asia (Israel, the early “Tiger” economies of East Asia, and the bits that used to be part of the Soviet Union excepted), where enrolments came closing to doubling over that period. The “North” (which includes Australia and New Zealand) grew much less quickly, but then again was starting from a very high base.
Figure 1: Gross Enrolment Rates, World, Global North and Global South, 2006-18
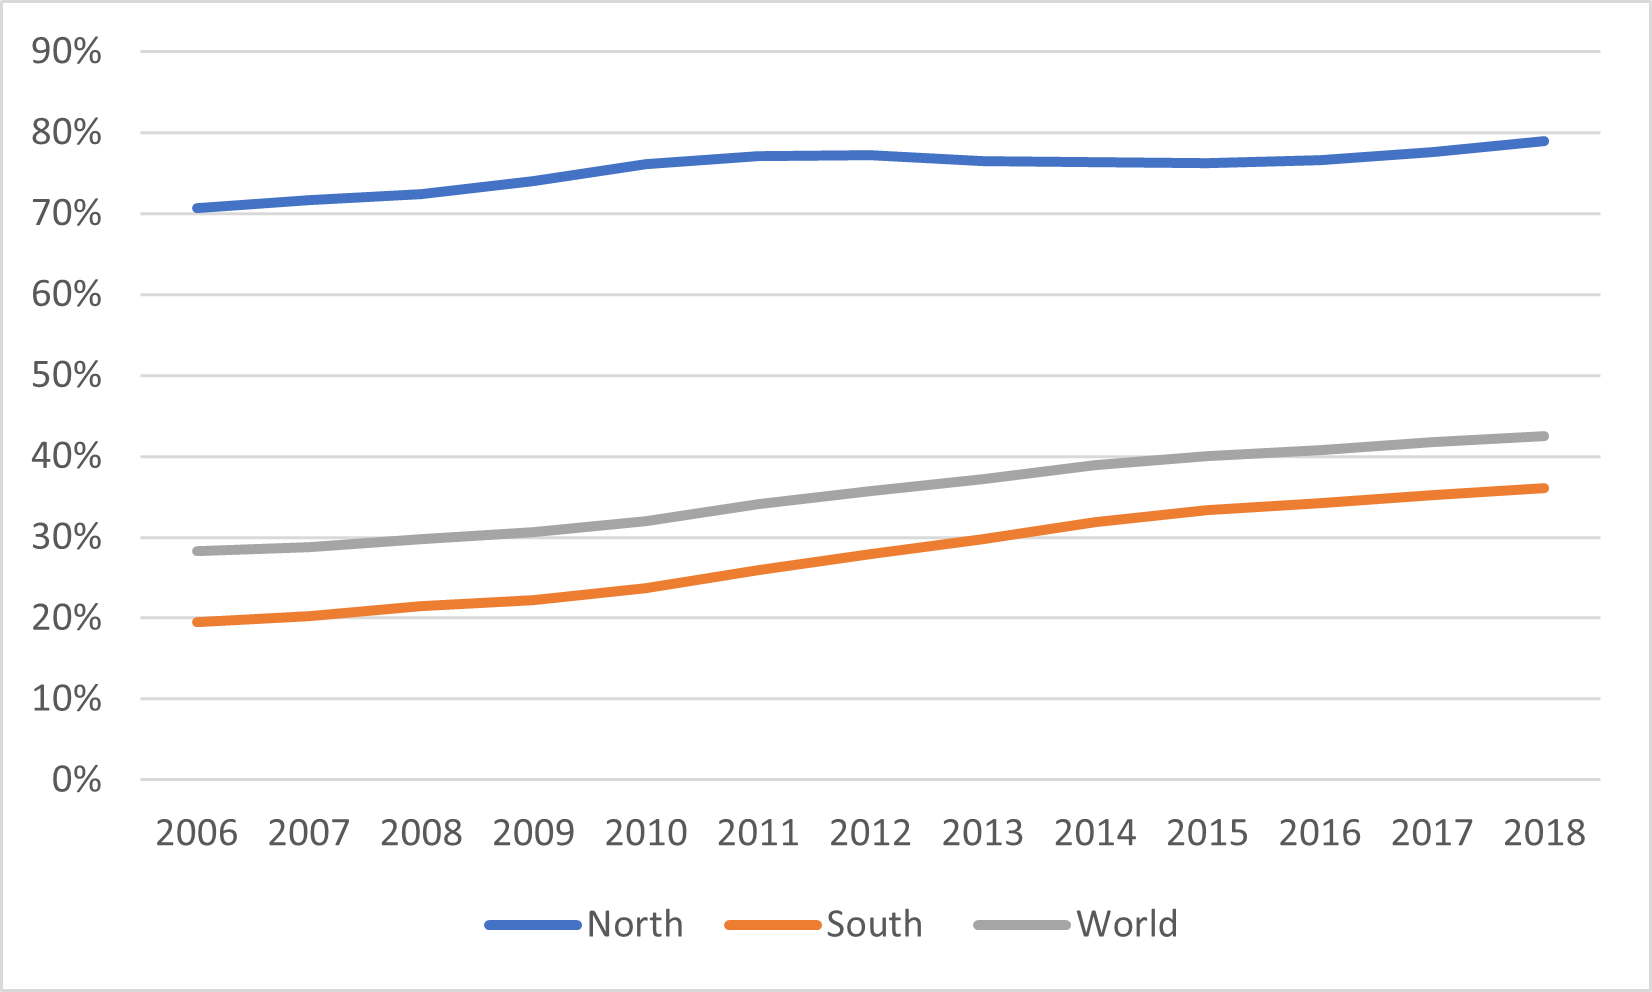
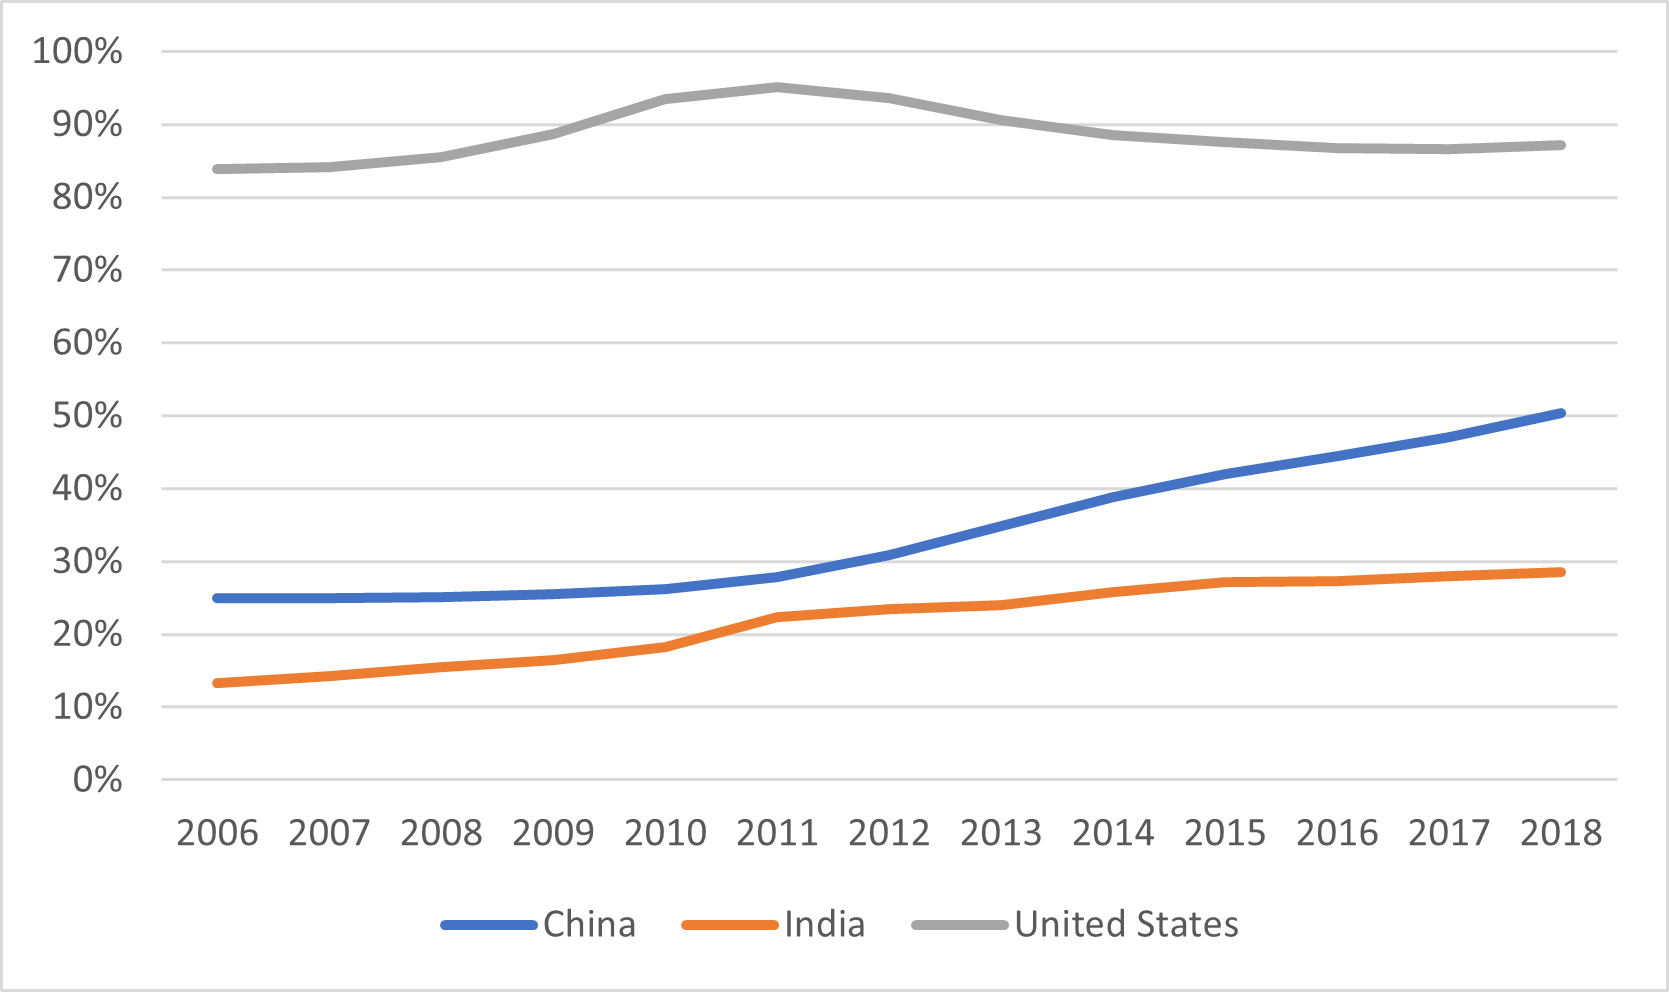
Figure 2 focuses on the “big 3” – that is, the three countries which collectively make up about half of all global enrolments: China, India and the United States. One of the fascinating things about this graph is the way it makes growth in India and China look divergent. In fact, both countries added about 20 million students between 2006 and 2018: the difference is that the size of the 20-24 age cohort in China has fallen by a little over 30% since 2011, while in India it has risen by 6%. Meanwhile, the United States, after a temporary bump in enrolments related to the 2008 recession, ended the period with about the same participation rate as it had at the start.
Figure 2: Gross Enrolment Rates, India, China, United States, 2006-18
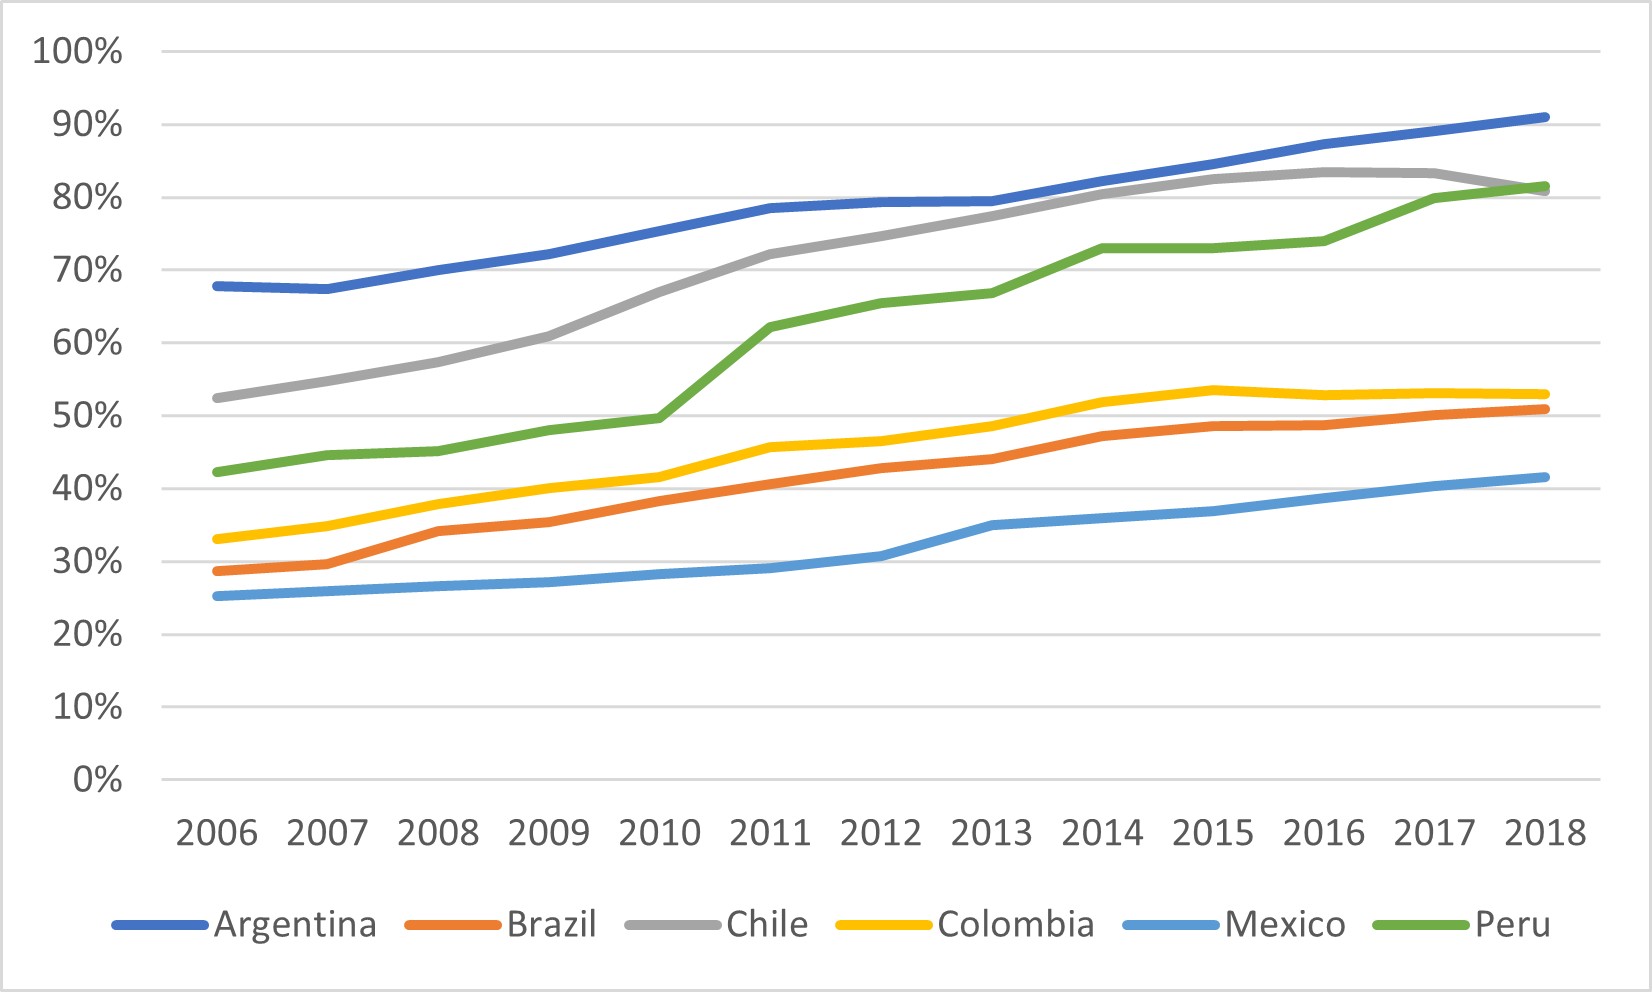
Back in 2006, the region of the Global South with the highest participation rates in the world was Latin America. One might have expected that starting from a high base would imply slower growth, but that is not really the case. Argentina’s participation rates, for instance, are among the highest in the world, higher even than the United States. Chile’s and Peru’s are not far behind (though intriguingly Chile’s rates started inching downwards at right about the time gratuidad was introduced, and obvs correlation =/= causation, but that one is worth investigating).
Figure 3: Gross Enrolment Rates, selected Latin American Countries, 2006-18
Maybe the most surprising region is the broader Middle East/North Africa region, which includes Turkey and Iran. Rising participation rates everywhere – though Iran seems to be going through a significant dip post-2015 (enrolments fell from 4.8 million to 3.5 million from 2015 to 2018, possibly due to problems related to overeducation and graduate unemployment). The major story is Turkey, which now has the highest GER in the world, thanks in large part to the fact that one single university – Anadolu University – enrolls close to 2 million students a year via distance education.
Figure 4: Gross Enrolment Rates, Selected MENA Countries, 2006-18
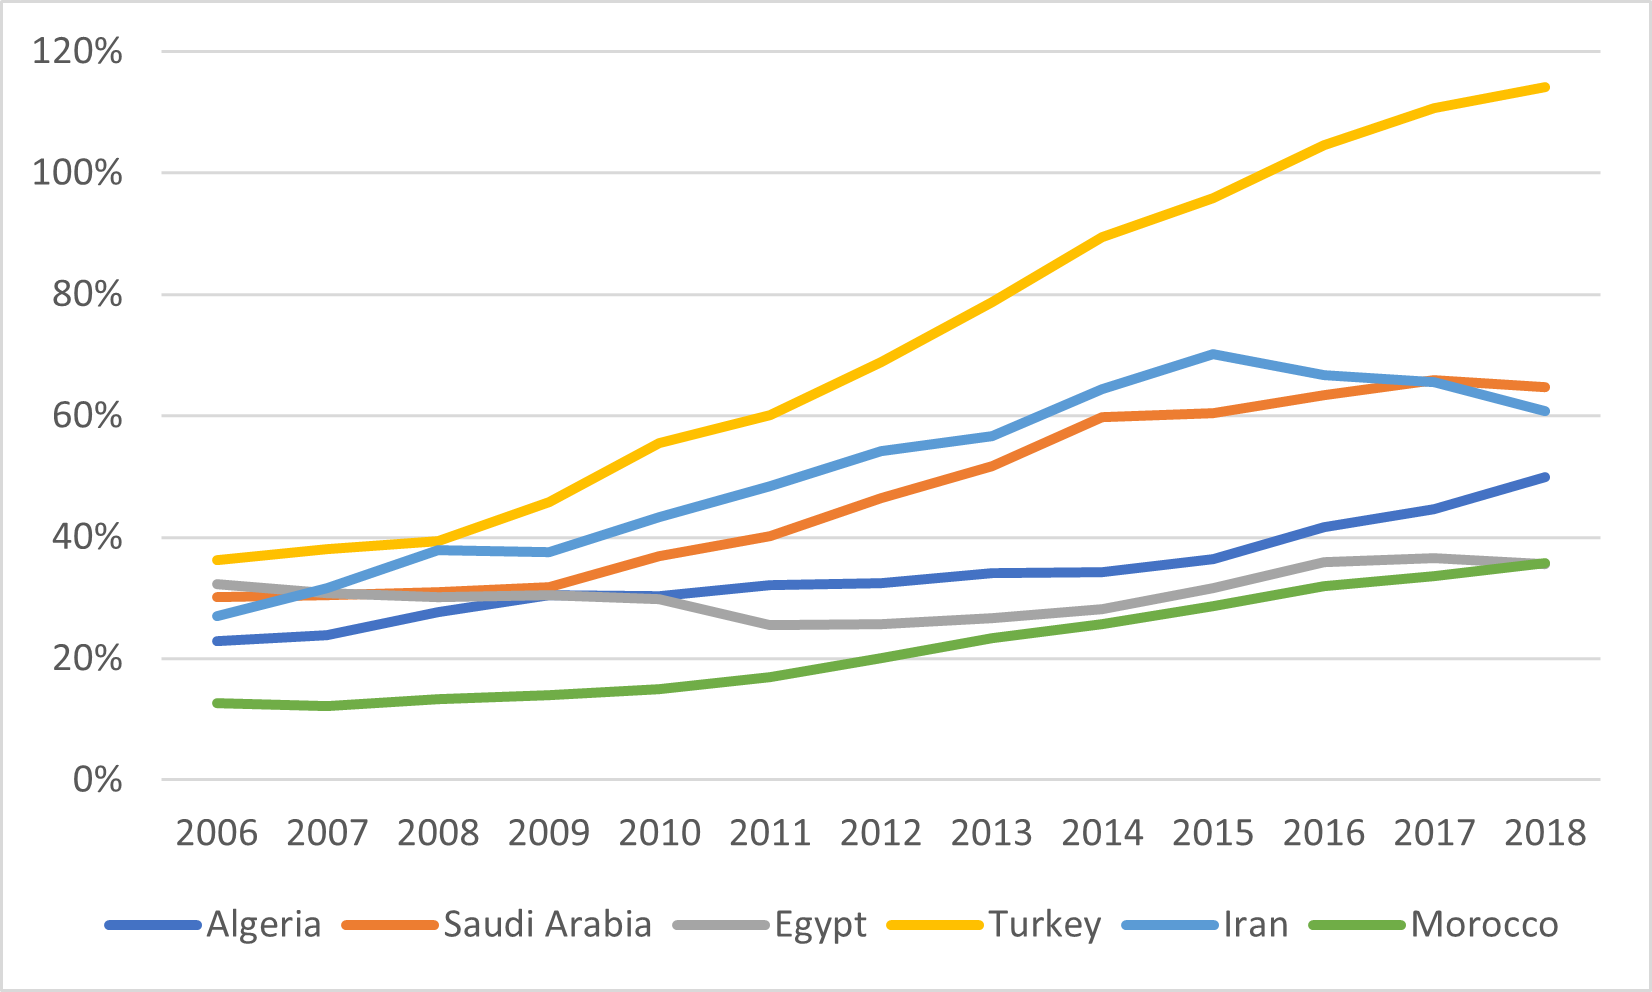
(If you’re wondering how an enrolment ratio can be over 100%, just remember the denominator is people aged 20-24, and students can be drawn from many different age groups).
Sub-Saharan Africa is another place where higher education is growing rapidly, doubling – albeit from a pretty low base – in nearly all examined countries between 2006 and 2018. The most intriguing country here is Kenya, which invested a lot of money in expanding universities in the post-2013 period and more than doubled its enrolments in the space about 3 years, lifting its participation rates out of the single digits and up towards the level seen in West African countries such as Cameroon, Benin, Ghana and Nigeria.
Figure 5: Gross Enrolment Rates, Selected Sub-Saharan Africa countries, 2006-18

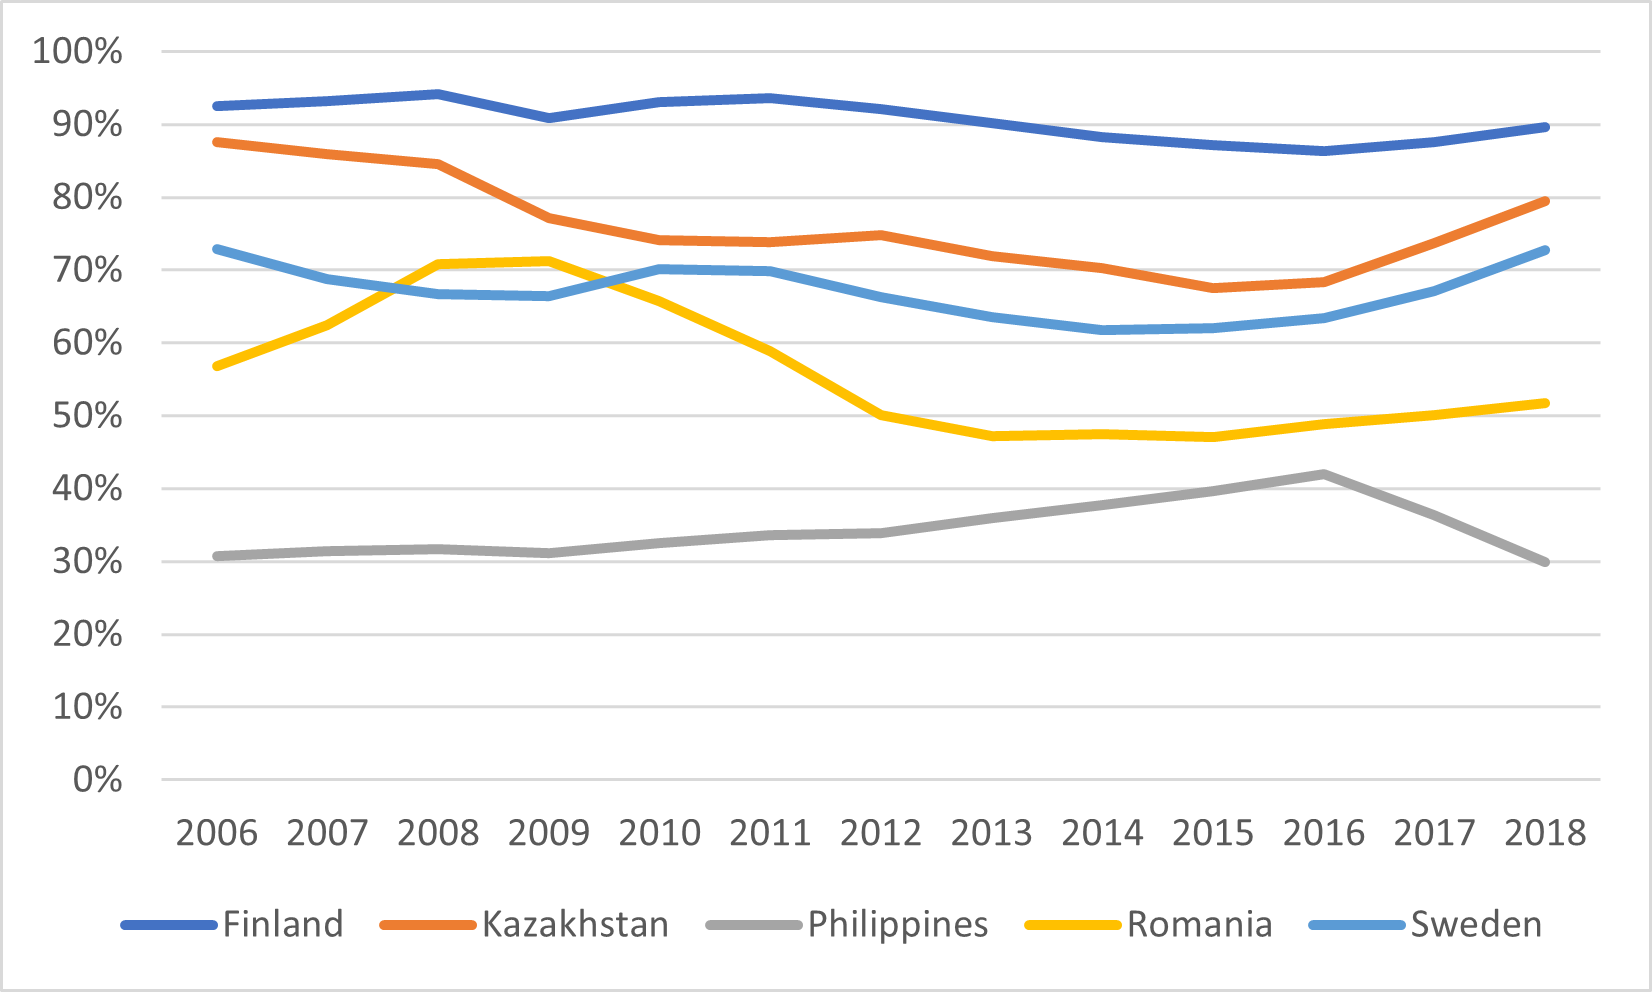
But progress in enrolment rates has not been universal. Among the 56 countries included in World Higher Education report, five ended the 2006-2018 period with lower participation rates. A couple of these I have covered before: Sweden’s decline came about because of a deliberate strategy to restrict access on the part of universities, while Romania’s came about mainly because of a collapse in enrolments at a university which the government essentially accused of being a degree mill. Maybe the most intriguing of these declines is the Philippines, which in 2017 and 2018 essentially underwent a kind of reverse double-cohort when the government moved from a K-10 system to a K-12 system thus deprived the higher education system of well over a million students in the short term. Post-2018, enrolment rates bounced back and have more or less reached 2016 level, so this is more of a temporary blip than a long-term change in participation rates.
Figure 6: Gross Enrolment Rates, Countries with Lower Participation Rates in 2018 than 2016
And that’s it. Happy World Access to Higher Education Day.


2 Responses
The link about declining enrolments in Sweden does not seem to work in the e-blast or on the website. Is it possible to fix it, or to send it to me?
With thanks,
Gordon Davies
University of Toronto
The link should work now, thank you!