


I’ve been puzzling over some Statscan data over the last few days, trying to make sense of what happened to the youth labour market during COVID. And it’s…well, it’s pretty odd. Not the story you usually hear.
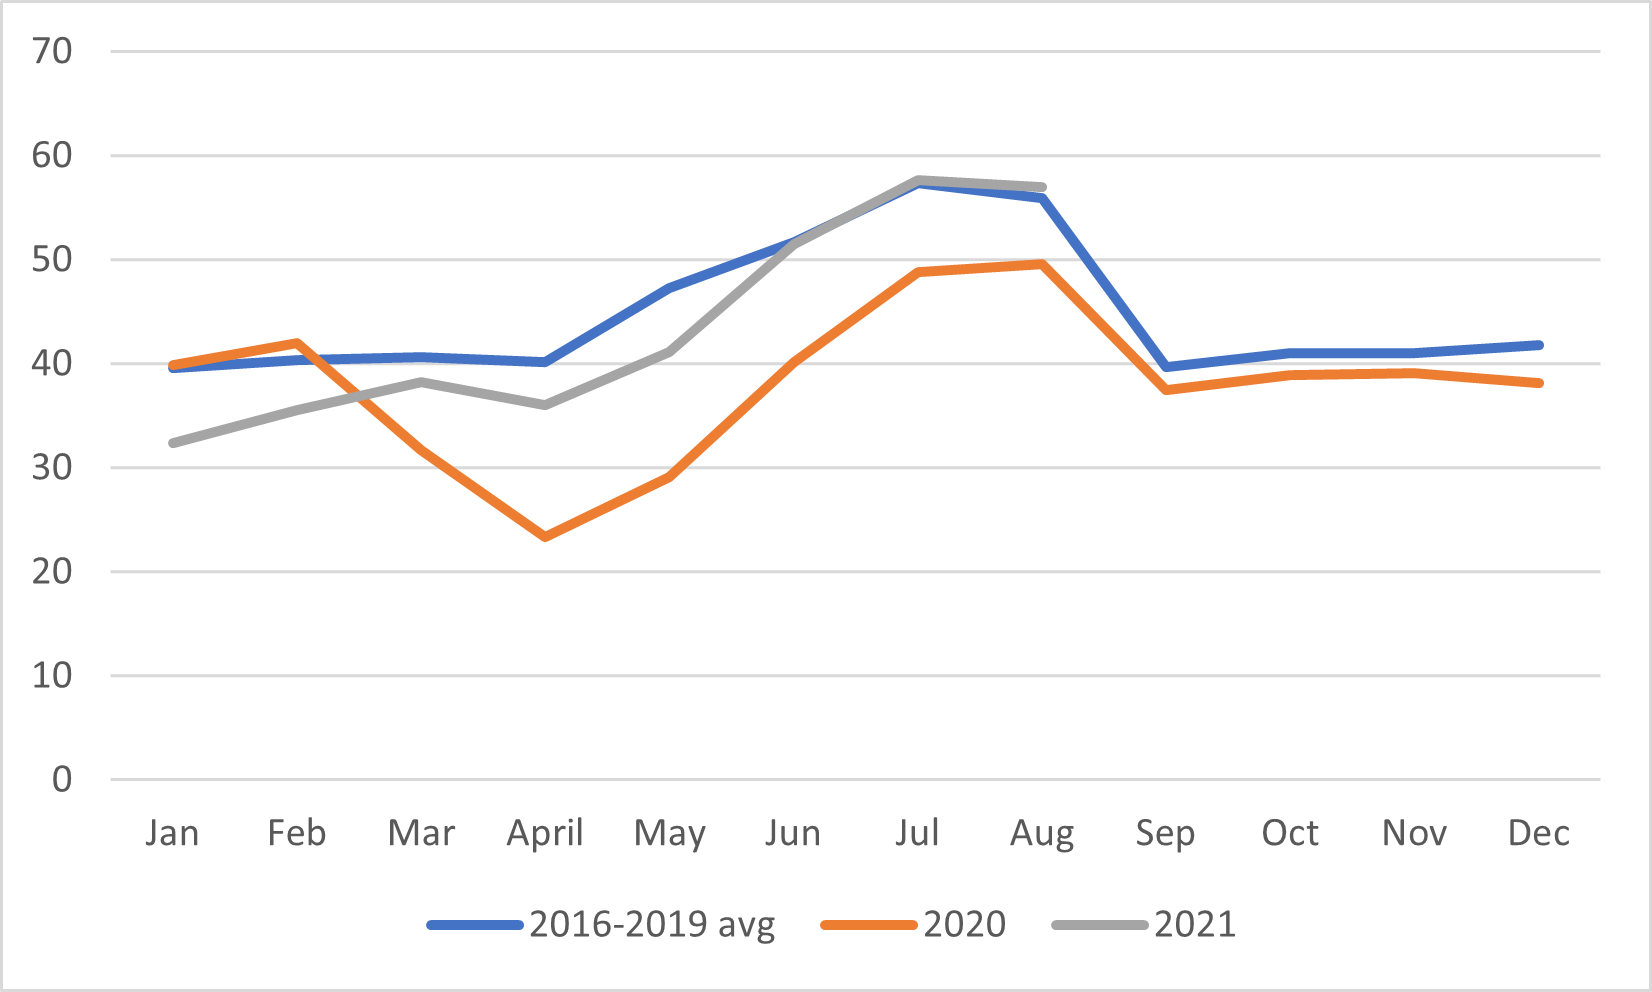
Let’s start with what happened to labour market participation. Figure 1 shows the monthly employment rates for full-time students, comparing the 2020 and 2021 results (at least up to August of this year) to the average of the years 2016 through 2019. What we see is that 2020 started off well, but by April, the employment rate had dropped 18.5 percentage points below the average of the previous four years. That was the nadir; after that employment recovered for the Fall of 2020, before seeing a drop again after Christmas. By Spring 2021, though, student employment was back to where it usually was. (Because vaccines work).
Figure 1: Employment Rate of Full-Time Students, 2016 to 2021
Now that’s just employment. What about hours? Well, we can’t get this data directly for students, but we can get it for the 15-24 population as a whole and that’s roughly indicative of what happened to student hours. Figure 2 shows the average number of hours worked among those who had work. And the answer is that there isn’t a whole lot of difference between 2019, 2020 and 2021. In fact, if anything, the only difference is that those who did survive the massive layoffs at the start of the pandemic actually picked up a couple of extra hours on average.
Figure 2: Average Weekly Hours Worked, 15-24 year-olds, 2019-2021
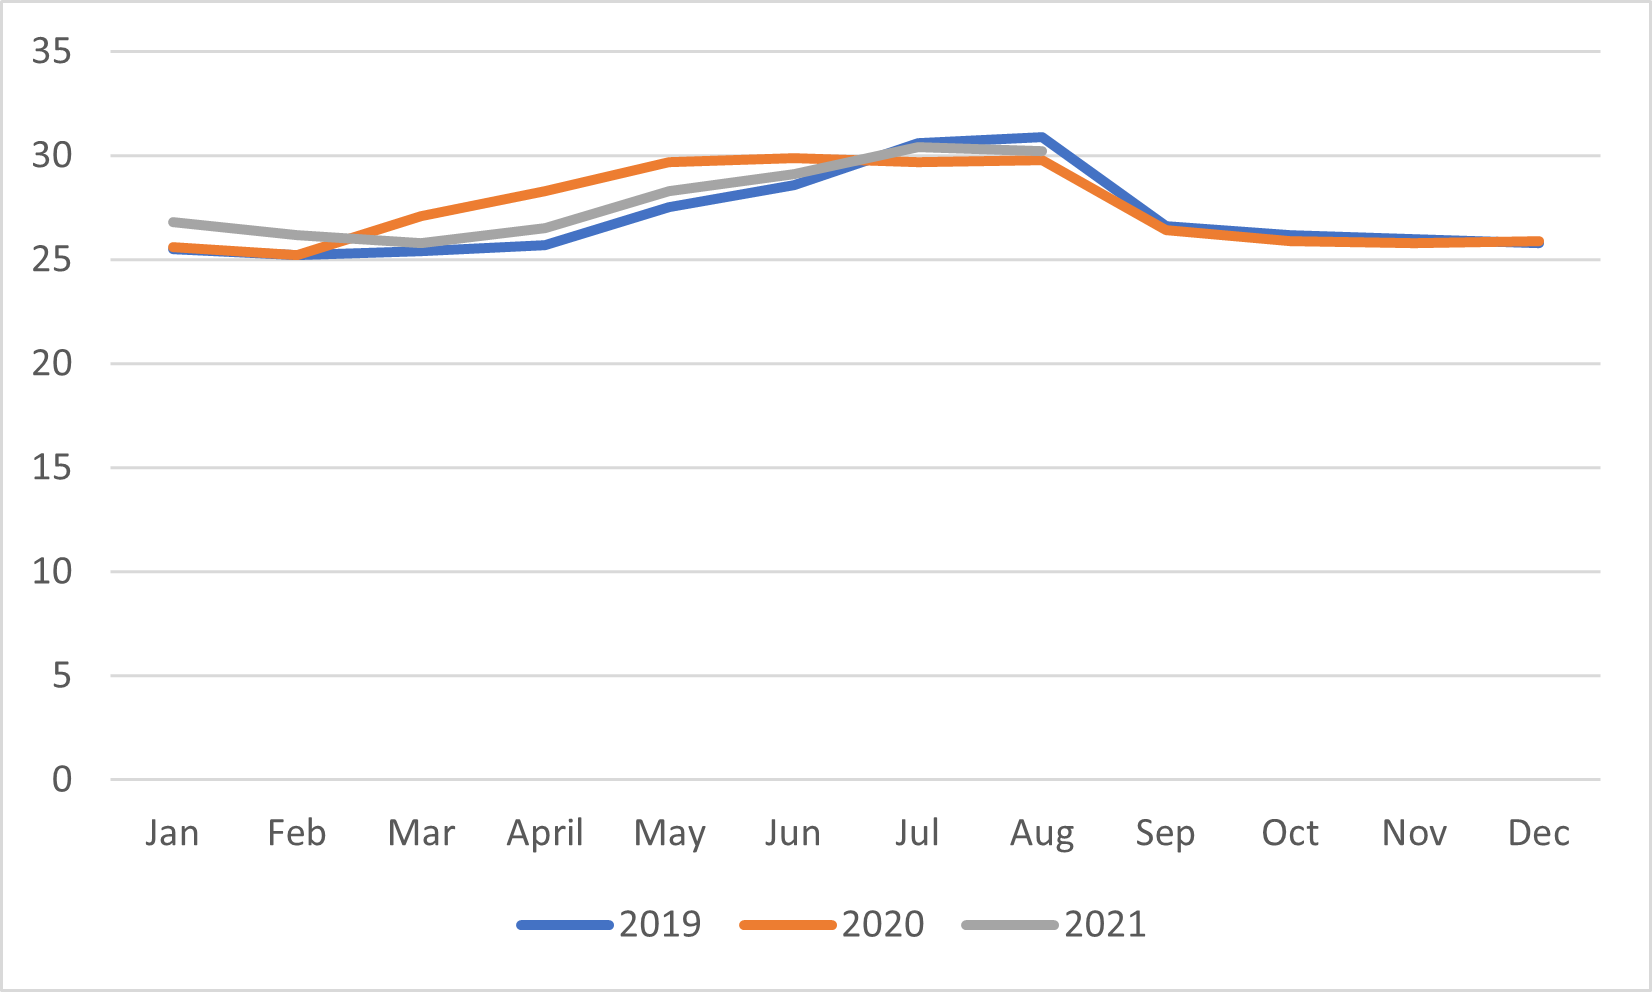
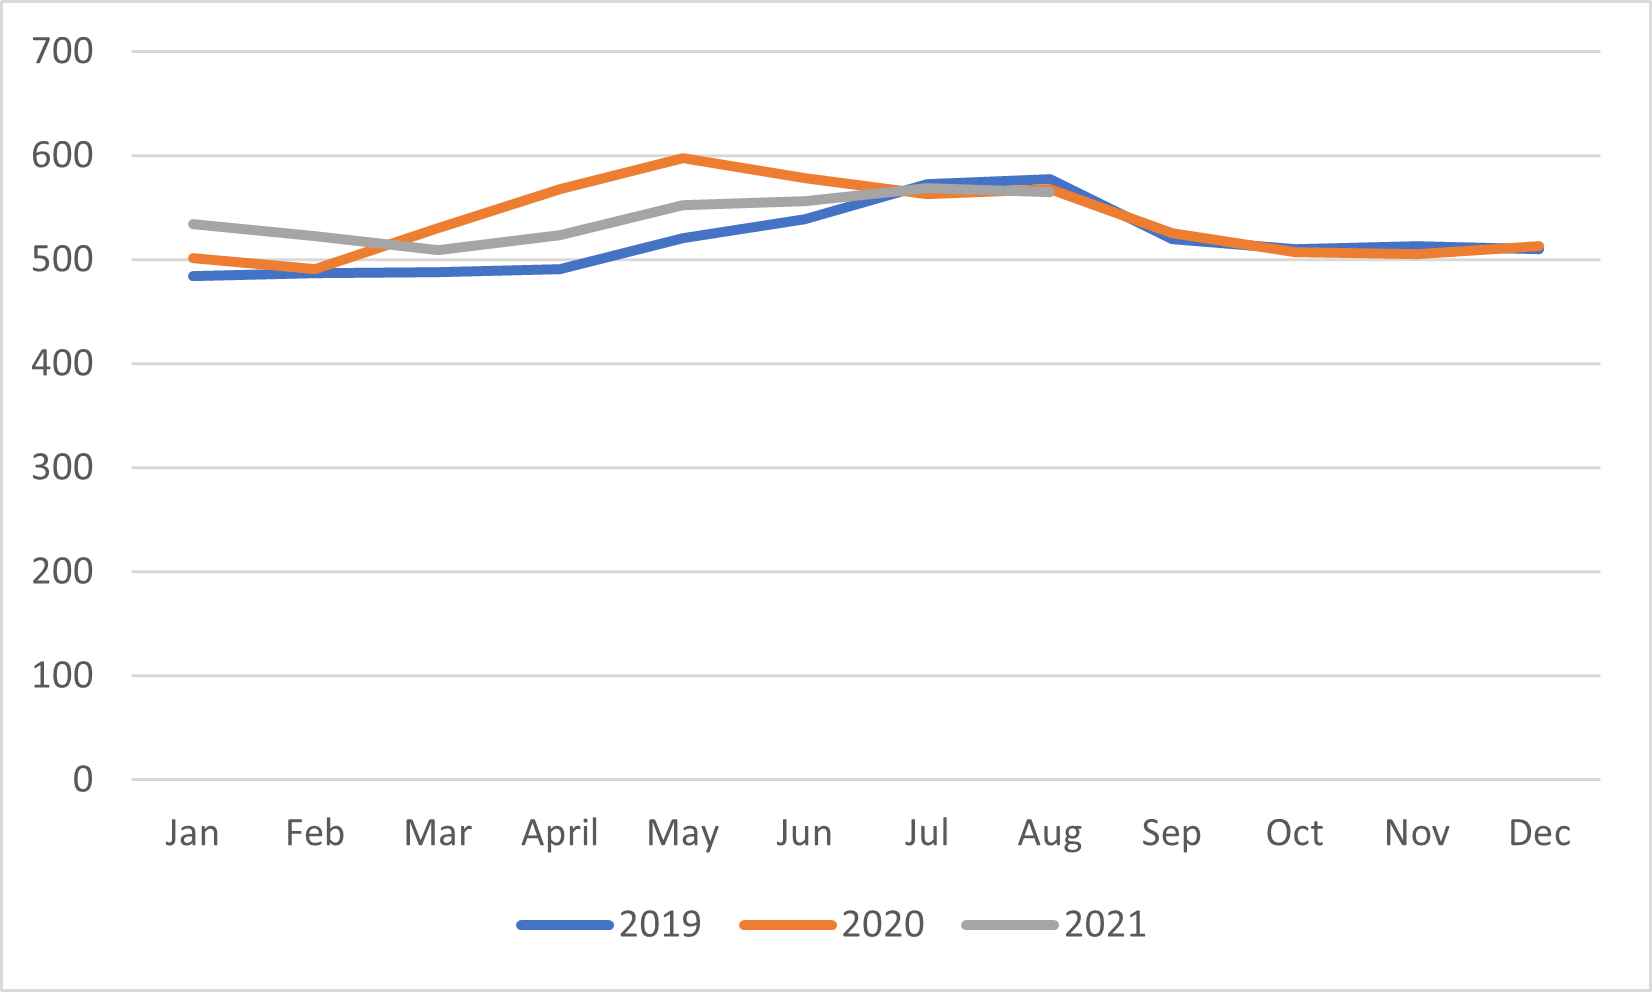
Figure 3 shows average weekly earnings among 15–24-year-olds. Again, this isn’t exactly equivalent to student earnings (students tend to work fewer hours from September to April) but the trend line should be pretty similar. And here what we find – unsurprisingly given the data in Figure 2 – is that wages among those who worked – was pretty similar in all three years.
Figure 3: Average Weekly Wages of 15–24-year-olds, in Constant August 2021 dollars, 2019-21
Now let’s think a bit about what this means. Basically, during the fifteen months between March 2020 and May 2021 (after which the employment gap closed again), full-time student employment rates were an average of seven percentage points. Given that there are about 1.3 million full-time domestic students, on average over those fifteen months, about 90,000 students could not find work. For most months it was less than that, but in the worst month – May 2020 – it was closer to a quarter-million.
We don’t have exact access to student wages, so any exercise which looks at lost student wages is a bit of a back-of-the-envelope affair. But if we assume that student income is equal to the income of all 15-24 year-olds in the summer months (probably an undercount) and that it is about 60% of the average in non-summer months, then lost wages were somewhere in the region of $2.5 billion, a bit more than half of which occurred in the summer of 2020. If we assume the summer numbers were an undercount, that probably pushes the numbers up to around $3 billion.
Now, guess how much money was spent on CESB during the summer of 2020? It was $2.99 billion. This was less than $5.5 billion originally budgeted, but still a heck of a lot of money. That means effectively the CESB cancelled out pretty much all the losses of the entire pandemic, and probably replaced about twice the lost student income in the summer of 2020 itself.
Success story? Well, sort of. The losses were actually pretty highly contained to about 20% of the student body. But the benefits got spread around a lot more widely: over 700,000 individuals received at least some CESB. And who was it who benefitted? Well, we don’t know for sure exactly, but take a close look at Figure 1 again. It suggests that even in a normal year, roughly 40% of students don’t work. Maybe they are studying, maybe they are travelling (though not in Summer 2020, obviously), maybe they are taking care of family members – whatever. The point is, there is a very good chance that a lot of CESB money ended up in their hands, because they would have made up somewhere between half and two thirds of all those eligible.
The quality of publicly-available data available does not make it easy to come to any exact judgement here. Certainly, there were probably a number of students who saw a reduction in their incomes during the pandemic. But it also seems likely that quite a few saw an increase in their incomes, and on aggregate, the whole experience might have been a wash, at least financially. It would be interesting if someone with more precise data could take a shot at establishing whether this is in fact true.
Tomorrow: what actually happened to institutions.

