


It occurred to me the other day that the oldest set of international rankings – that is the Academic Rankings of World-class Universities (ARWU), also known as the Shanghai Rankings – have now gone through 20 iterations. I’m not one who believes that year-to-year changes in rankings mean much (too much noise, not enough signal), but twenty years of data? As an old colleague of mine once said, if a research result is strong enough, even a weak methodology will pick it up. So, let’s go see where the strong signals are in global rankings.
A few words about the ARWU rankings. First, I am on their international advisory committee, so, you know, salt, etc. Second, it is by far the most stable of the major rankings, with almost no methodological changes since it was begun (the biggest one was imposed from the outside, when Thompson Reuters re-jigged the way it published its list of “Highly Cited” academics), thus permitting real long-term analysis. Third, it is all third-party data, mainly of the bibliometric variety; institutions do not have the ability to monkey with any of the indicators and there are no surveys involved. And fourth, it probably has the narrowest definition of a top university: precisely because it is so heavily focused on bibliometrics and academic prizes, what it measures best is where the greatest deposits of research talent lie. You might not agree with that definition of “world-class” but believe me, this set of indicators is well-engineered to determine exactly where the big deposits of scientific expertise are. Or, if we’re looking over 20 years, how these deposits have shifted over time.
So, what do we find when we look at the 20-year shift? Well, if you just look at the top 15 institutions, you could surmise that nothing has changed. Those 15 institutions are still comprised of 13 American institutions and 2 British ones, the only real difference being that UC San Diego and UC San Francisco have dropped out of the top 15 (to 21st and 19th spots, respectively) and being replaced by Johns Hopkins and U Penn. There’s a little bit more change if you look at the top 50 – the Americans now only take up 28 instead of 35 of the top 50 spots, but still, No change at the top so nothing to see here, right?
Wrong. Things have changed a lot. You just need to look a little deeper into the data.
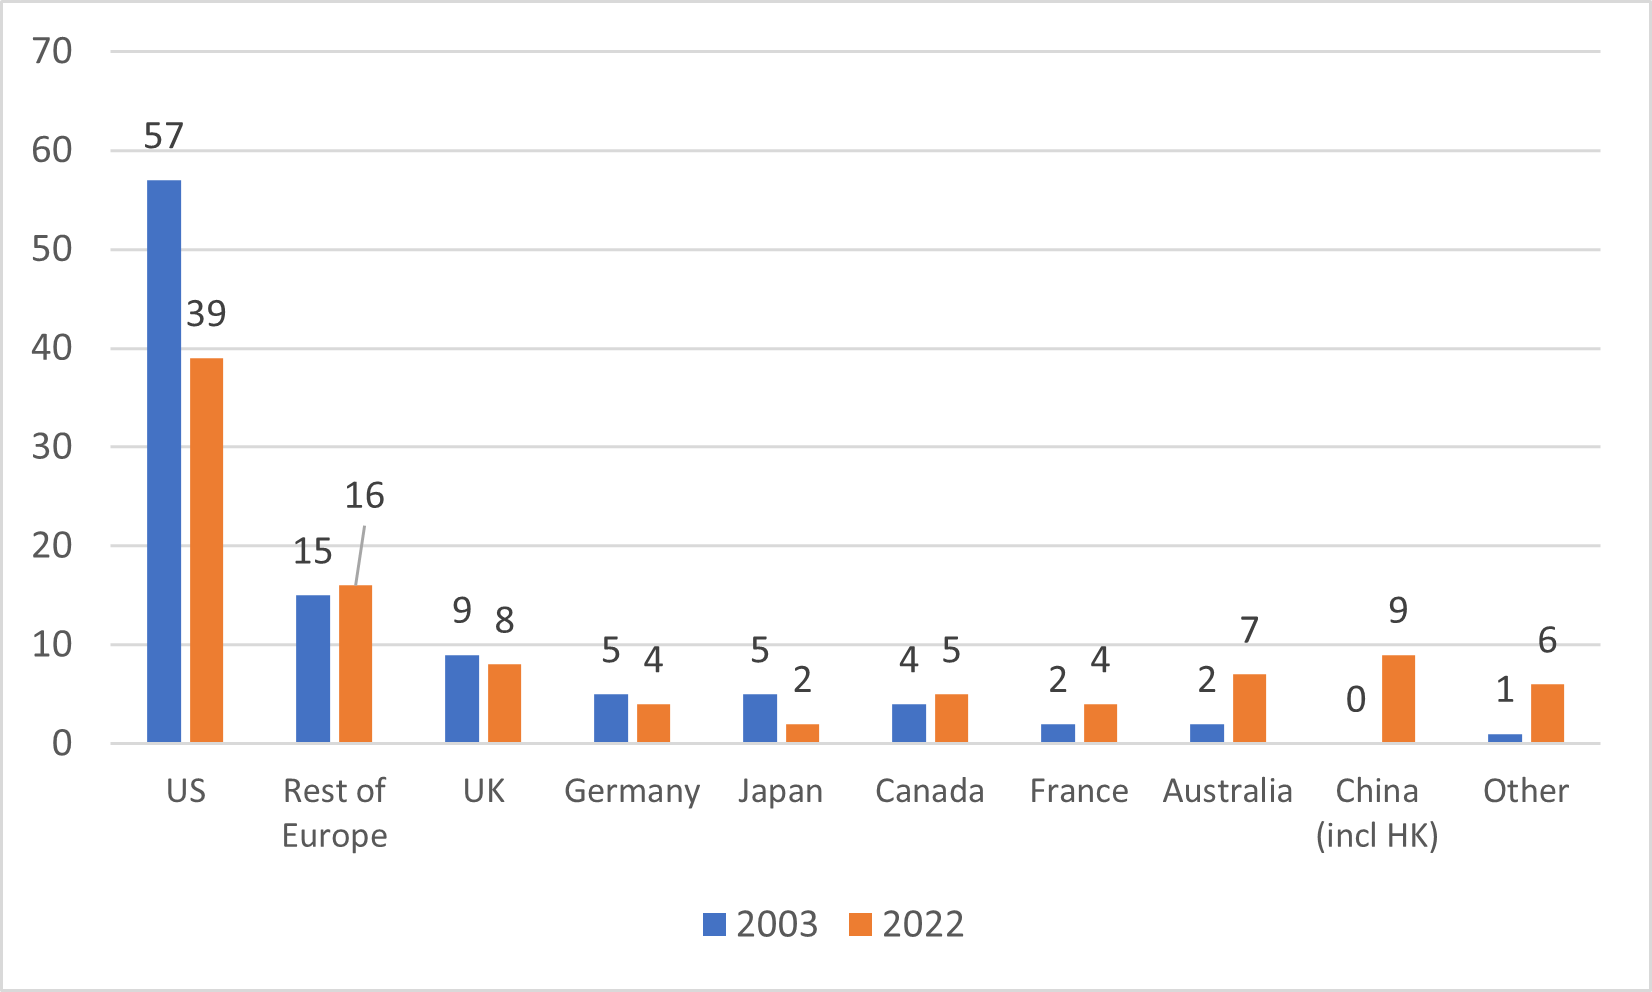
Figure 1 shows the Shanghai top 100 by country in 2003 and 2022. The big takeaways are: i) American universities outside the top 30 or so are getting hammered ii) so are Japanese universities, iii) their places by and large are being taken by institutions in Australia, China, Israel and Singapore, the last two comprising five of six of the “other” nations. All four French institutions now in the top 100 – Saclay, PSL, Sorbonne, and Paris-Cité – are the result of mergers that have taken place over the last decade that were explicitly done to improve French performance in international rankings.
Figure 1: Top 100 institutions in Shanghai Rankings by country/region, 2003 vs. 2022
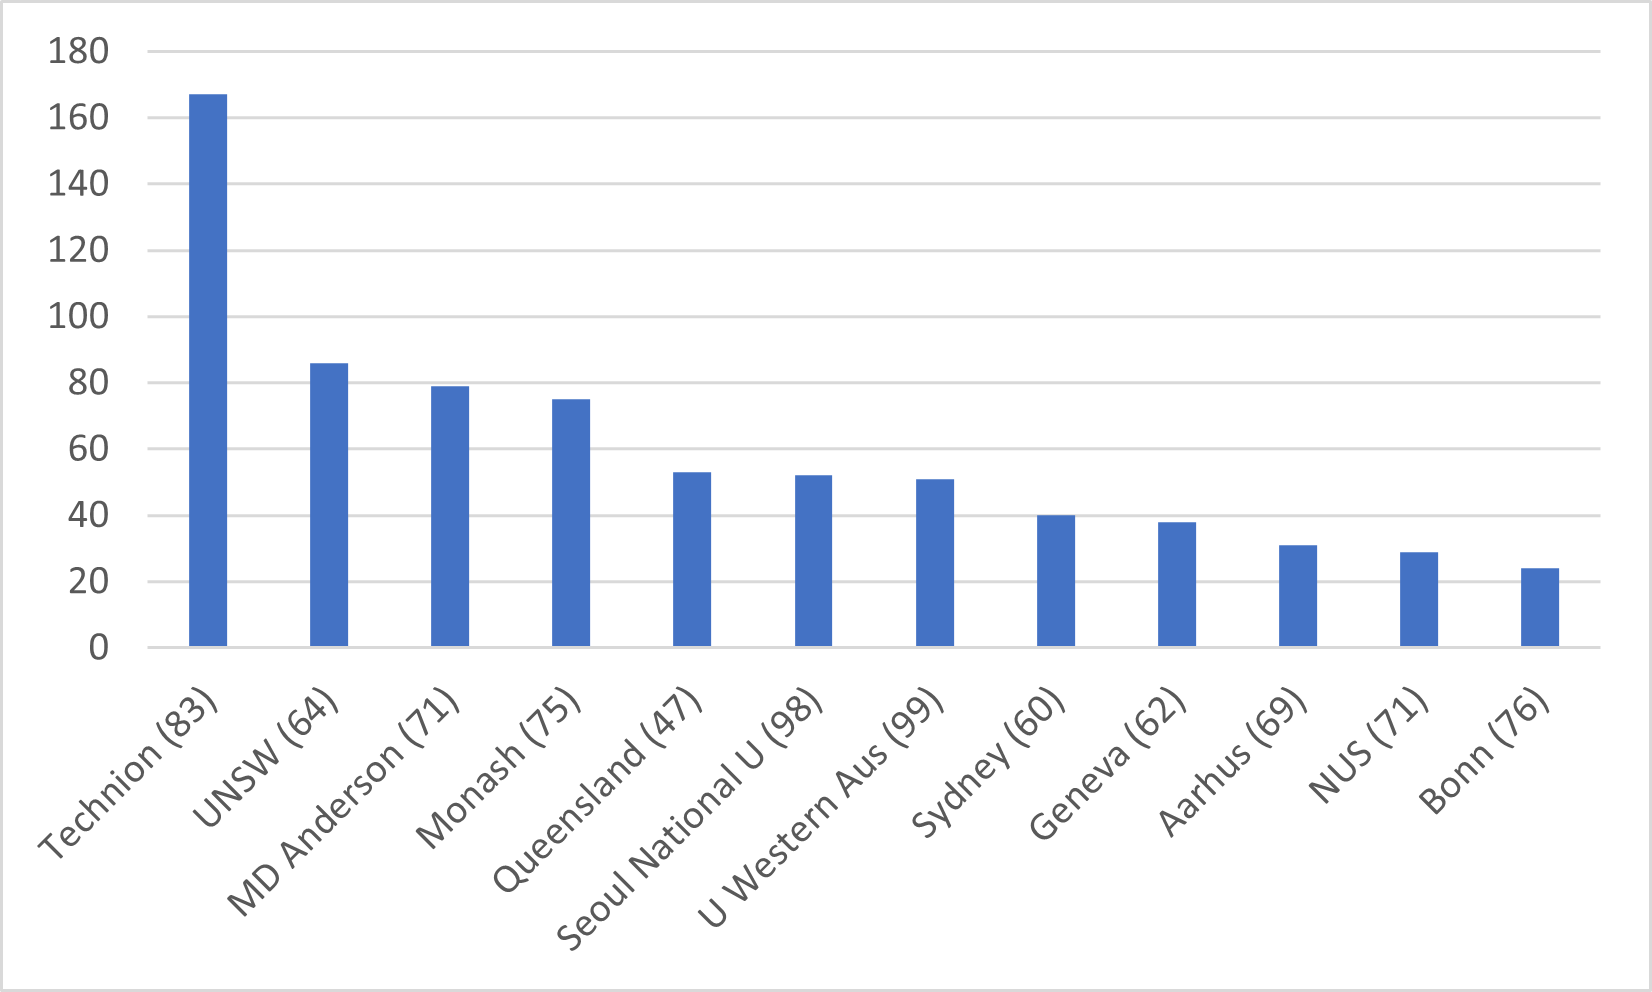
But national-level analysis only takes you so far. Let’s look at the individual institutions who are the movers and shakers over those 20 years. Figure 2 shows the top 100 institutions outside China that have risen the fastest in the rankings over the past two decades, and the minimum number of positions they have risen (I say minimum because the Shanghai Rankings aren’t as into faux precision the way other rankings are, so below 100 all positions are in ranges like 101-150 or 400-500. Thus, I mark progress from the highest position they might have had). Technion in Israel moved up over 170 places, University of New South Wales over 80, and Monash and MD Anderson (that’s the University of Texas’ cancer research centre) over 75 each. These are massive changes in institutional positioning and the Australian results in particular show that it is possible for institutions to manage their way to improved research outcomes even in the absence of large pools of new funding.
Figure 2: Fastest-Rising Universities in the Shanghai Academic Rankings Top 100, by Minimum Places Risen, 2003 to 2022 (2022 ranking position in parentheses)
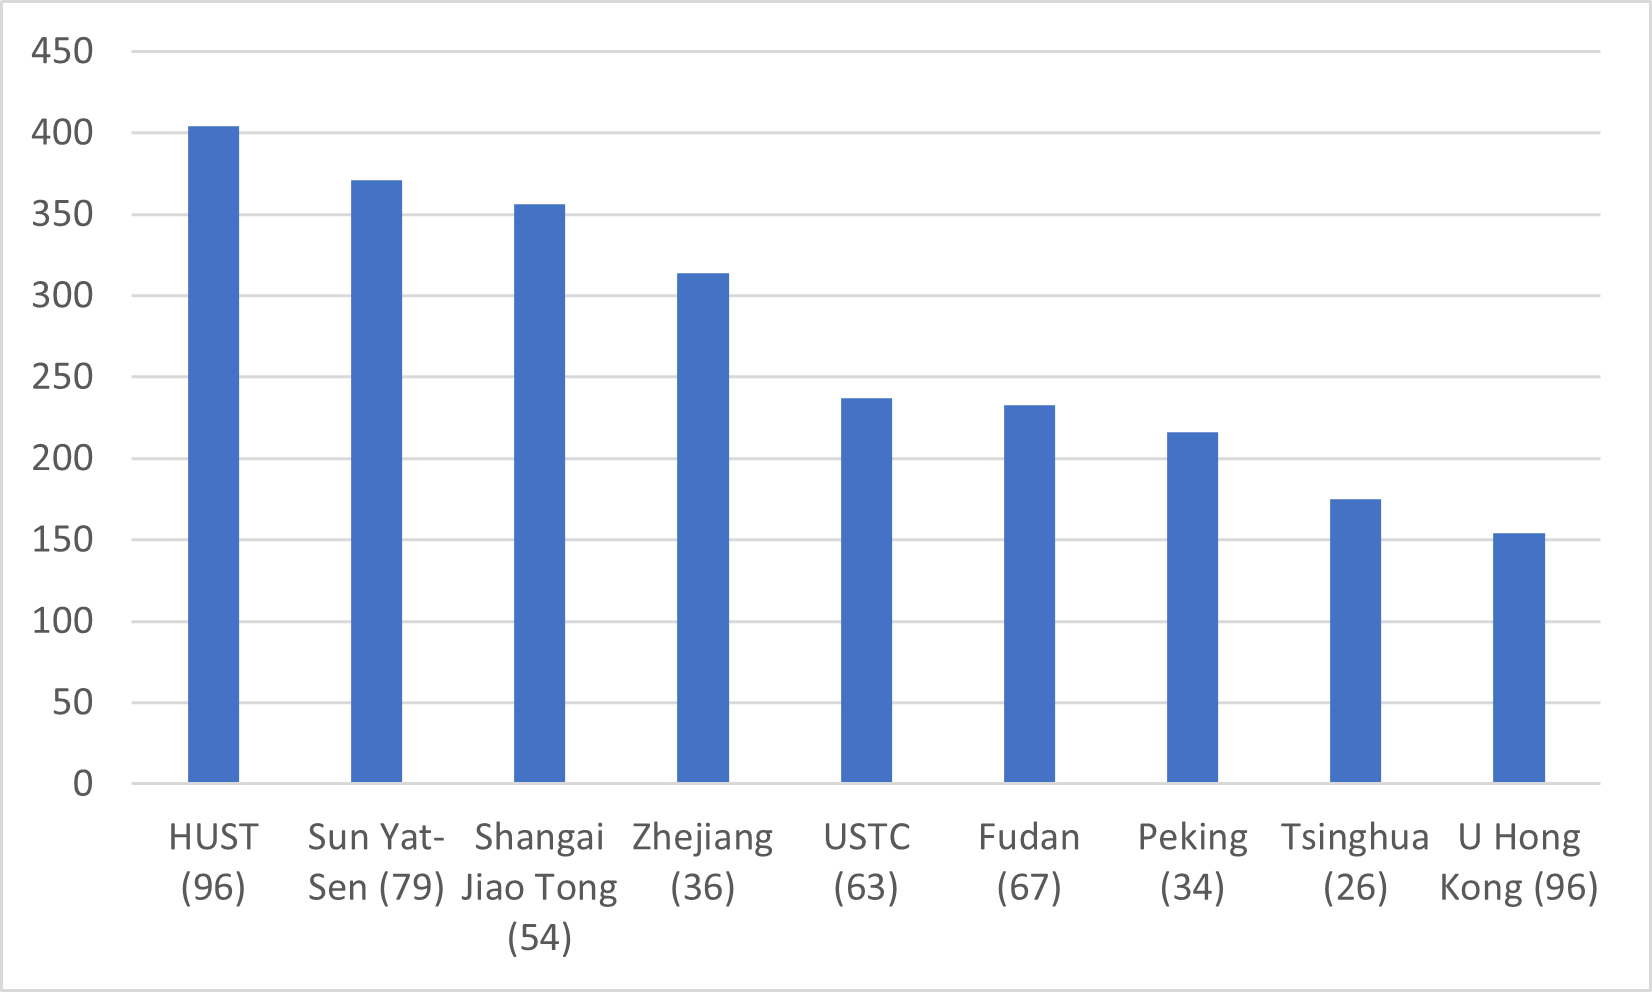
But man, it’s the Chinese institutions that absolutely blow your mind. In 2003, no Chinese institution was in the global top 200. In fact, one of the ones now in the top 100 – the Huazhong University of Science and Technology (HUST) – wasn’t even in the top 500 until 2008. Making it into the top 100 is an incredible feat, and while significant boosts in funding have been a big part of the story here, changes in institutional management have also played their part.
Figure 3: Fastest-Rising Universities in the Shanghai Academic Rankings Top 100, by Minimum Places Risen, 2003 to 2022 (2022 ranking position in parentheses)
On the flip side, take a look at what’s going on with American universities. The story you usually hear is that government funding cuts have devastated public institutions and that’s why American higher education appears to be in relative decline. But that doesn’t seem to be the case. In fact, many of the really big losers seem to be second-tier private universities.
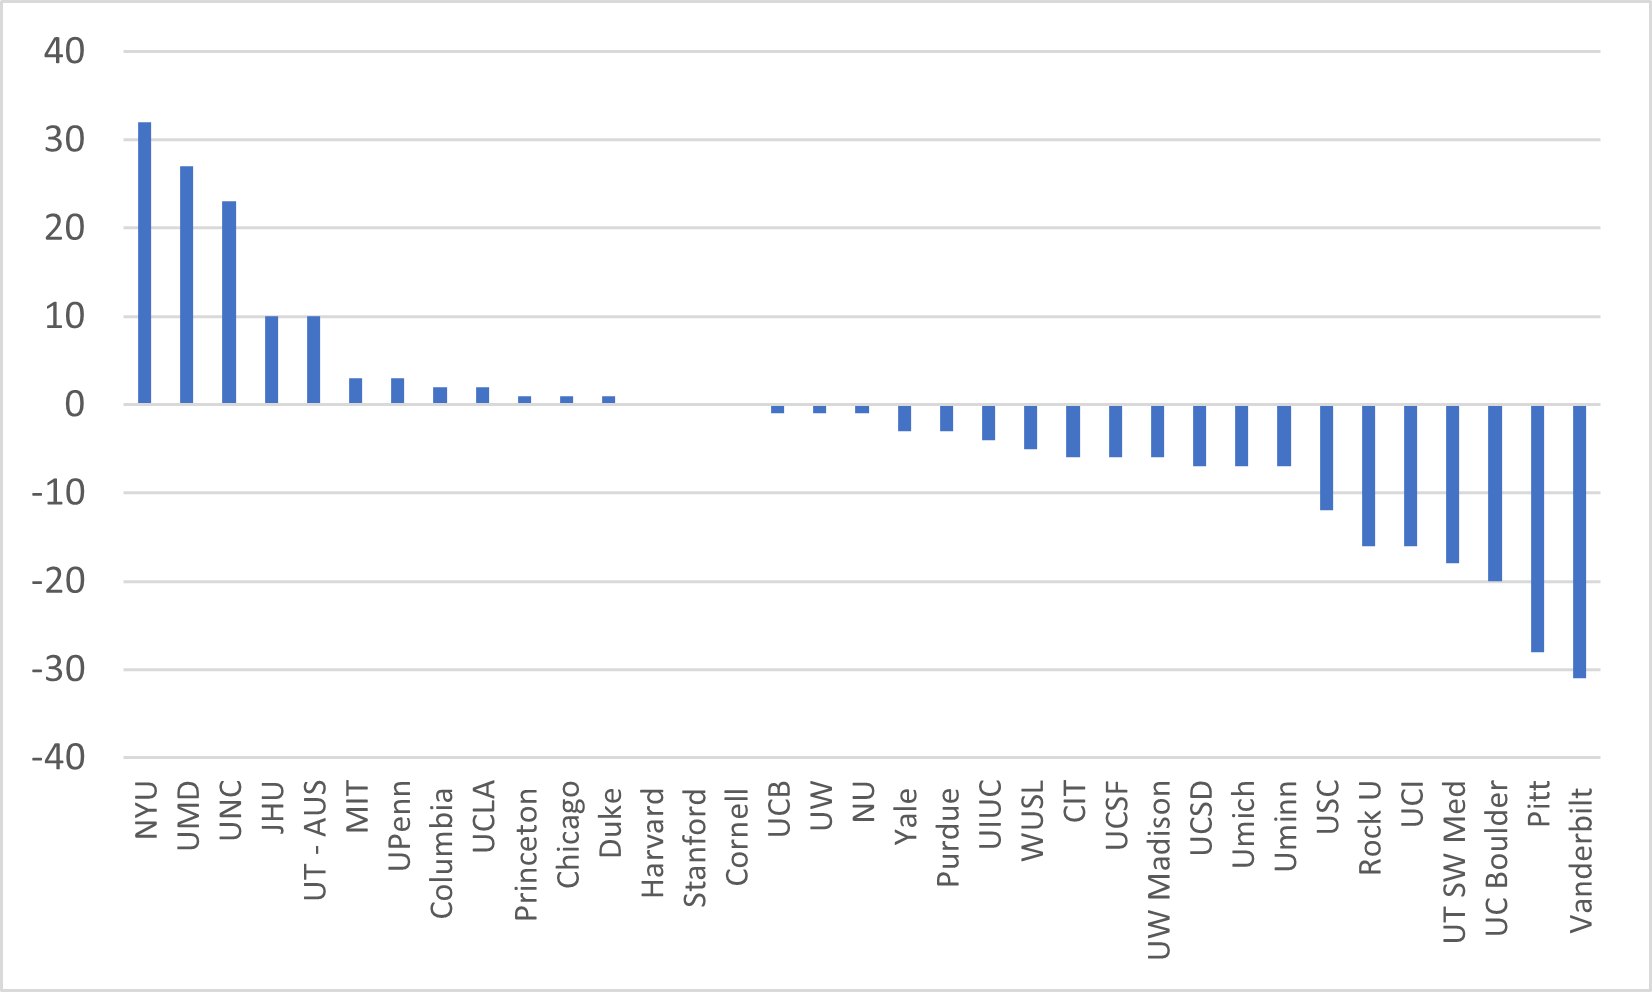
Figure 4 leaves aside the institutions that fell out of the top 100 and just focuses on the 38 that stayed in (we’ve already looked at the MD Anderson, which is the only new American institution in the top 100). Certainly, there are institutions that declined significantly, the most significant of which were Vanderbilt and Pitt. Of the seven institutions that fell more than ten places (while still staying in the top 100), four were private. But look at the top end: NYU, Maryland and North Carolina: those institutions, two of them public, rose by over twenty places in the rankings. For UM and UNC, that was without any abnormally large infusion of new state cash in those two decades. That, presumably, is about institutional leadership and focus (I would be remiss here not to remind everyone that the former longstanding President of the University of Maryland, Freeman Hrabowski, published his memoirs a couple of years ago and they are very much worth your time).
Figure 4: Change in Position Among 2003 Top-100 US Universities Which Remained in Top 100 in 2022
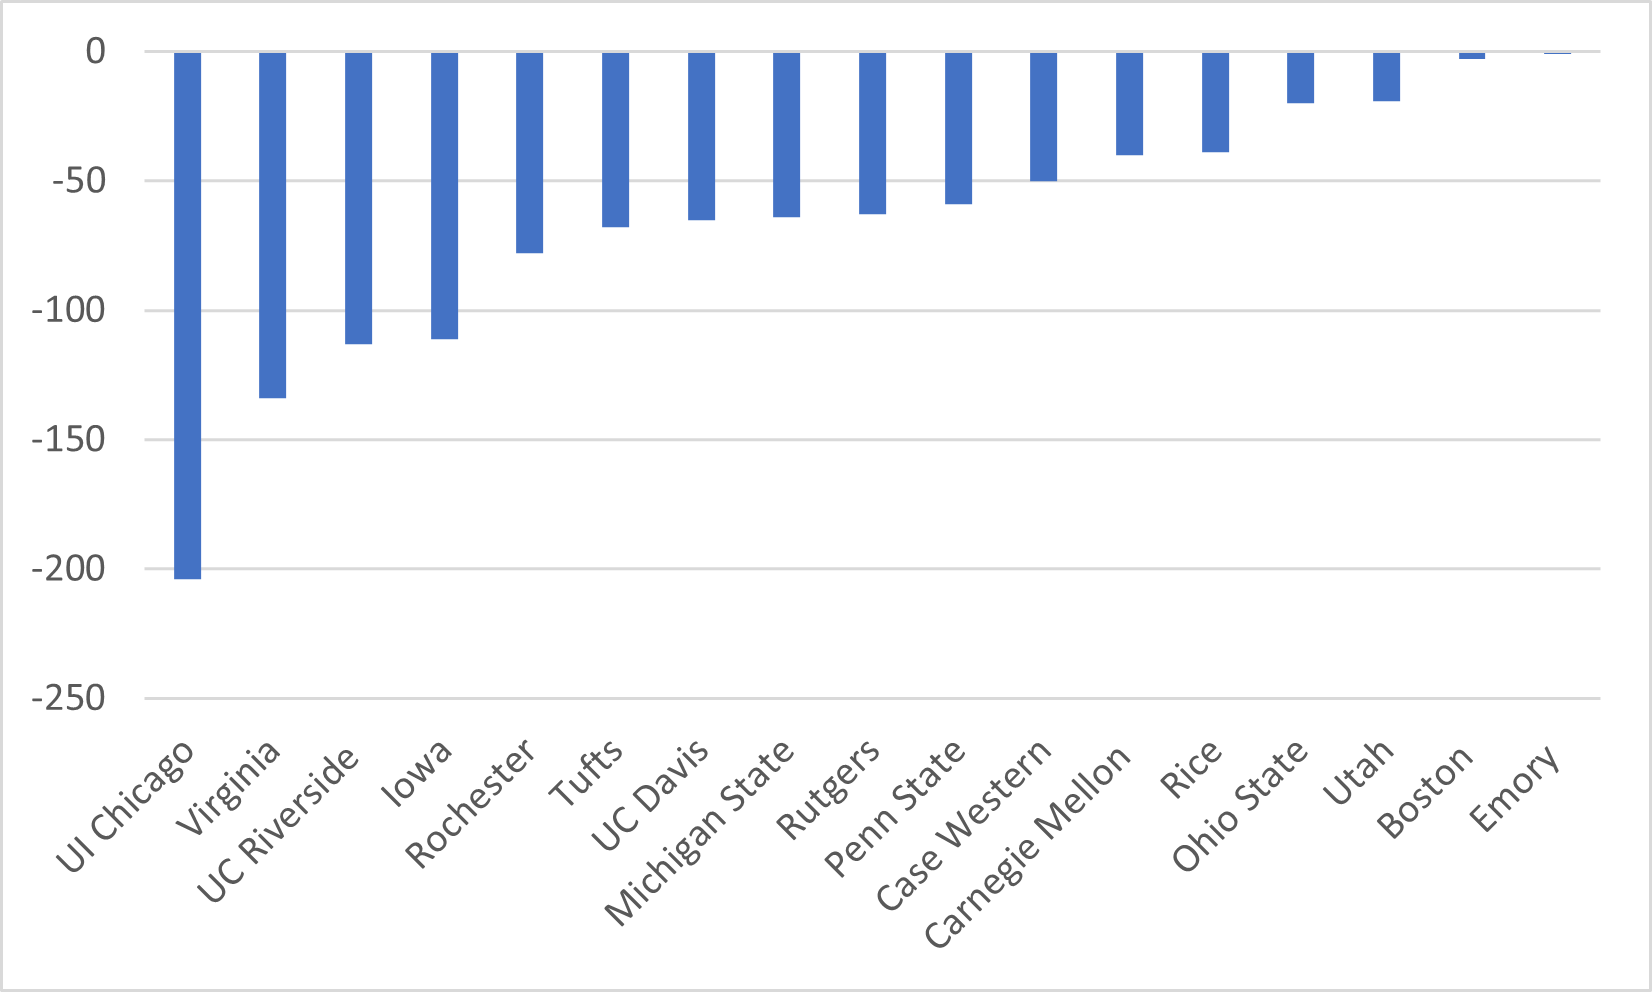
But what about the nineteen American institutions that fell out of the top 100? Well, we can’t tell exactly how many positions they have fallen because of the rank grouping, but it is possible to count the minimum number of places fallen. This is shown in Figure 5, below. It’s a really mixed bag of institutions that defy easy generalization. Sure, the University of Illinois Chicago and UC Riverside have had funding problems: but so too have Illinois- Champaign and UCLA and they have had very different rankings results.
Figure 5: Minimum Change in Position Among 2003 top-100 US Universities Which Fell Out of the Top 100 in 2022.
This blog is getting a little long, so I will have to postpone an analysis of what’s been going right or wrong at these institutions for another day. But my basic point here that while it is true that age, size and money have an awful lot to do with rank positioning, it seems clear that over a long enough period of observation there are enough examples of radical changes in position which cannot be explained by these three factors which suggest that institutional effort – be it a matter of management, faculty culture, or both – is a non-trivial factor in these rankings.


4 Responses
It is true that Australian universities improved research ranks ‘even in the absence of large pools of new funding’ only if one ignores revenue from international student fees, which Australian universities increased greatly over the last 20 years.
A quick note here that the U. Maryland that’s in the rankings is UMD College Park (the UMD “main campus”) but Hrabowski, whom you mention, was president of the smaller, and separate, UMD Baltimore County. UMDBC is currently ranked in the 601-700 bin in the 2022 report.
For the US PSIs who fell out by 50 ranks or less it probably has a lot more to do with the rapid ascension of some other universities and little to do with those specific PSIs (changes due to other institutions improvement don’t mean problems at the dropping institution). But dropping over 100 spots is huge and I can’t wait to see your analysis of that.
“All four French institutions now in the top 100 – Saclay, PSL, Sorbonne, and Paris-Cité – are the result of mergers that have taken place over the last decade that were explicitly done to improve French performance in international rankings.”
That’s just it: how much does any institution’s improvement show it actually getting better, and not just whoring after whatever the rankings measure?
This seems a classic instance of Goodhart’s Law in action.