


Kudos today to Statistics Canada, which is gradually producing useful information using its new Education and Labour Market Longitudinal Platform (ELMLP). Last Thursday it put out – weirdly, in conditions of almost total secrecy – a new set of tables looking at visible minorities and ethnicity in Canadian post-secondary education. This dataset required linking individual record data from the Post-Secondary Student Information System (PSIS), which does not record any data about ethnicity, with individual record data from the census, which does. Making this link allows for a very interesting look into the ethnic background of university students.
Before I get into the data, note there are two limitations to the data Statscan published. The first is that, for reasons that are not entirely clear to me, they chose to only look at “entering” (i.e. first-year) students at various levels of education. So, technically, these reports are only true for this subset of students rather than the student body as a whole (though I doubt that the figures for one are ever going to be that that different than figures for the other.). The second thing is the students identified here are exclusively Canadian students – that is, citizens and permanent residents. There are simply too few international students who were in the country on census days (May 10, 2016 or May 11, 2021) to make it possible to include them in the ethnicity analysis. At the end of this blog, I will try to give you a rough sense of how the international students change the data, but for the first few graphs, remember that the data excludes visa students.
Also, in terms of what constitutes a “visible minority” a quick refresh on how Statscan asks these questions is in order. The first question they ask is whether someone identifies as Indigenous. Only if someone clicks “no” to this question, are they asked a question about ethnic background, where the possible answers are i) White, ii) South Asian, iii) Chinese, iv) Black, v) Filipino, vi) Arab, vii) Latin American, viii) Southeast Asian, ix) West Asian (which definitely means Iranian, but I can’t tell if it includes Turks or not). x) Korean, xi) Japanese, xii) Other – specify. So “Indigenous” effectively is outside of the numbers here, included in neither the numerator nor the denominator. For those who think of “visible minority as simple “non-whiteness”, this survey structure undercounts the non-white category somewhat, particularly in Western Canada.
Got all that? Ok, let’s start.
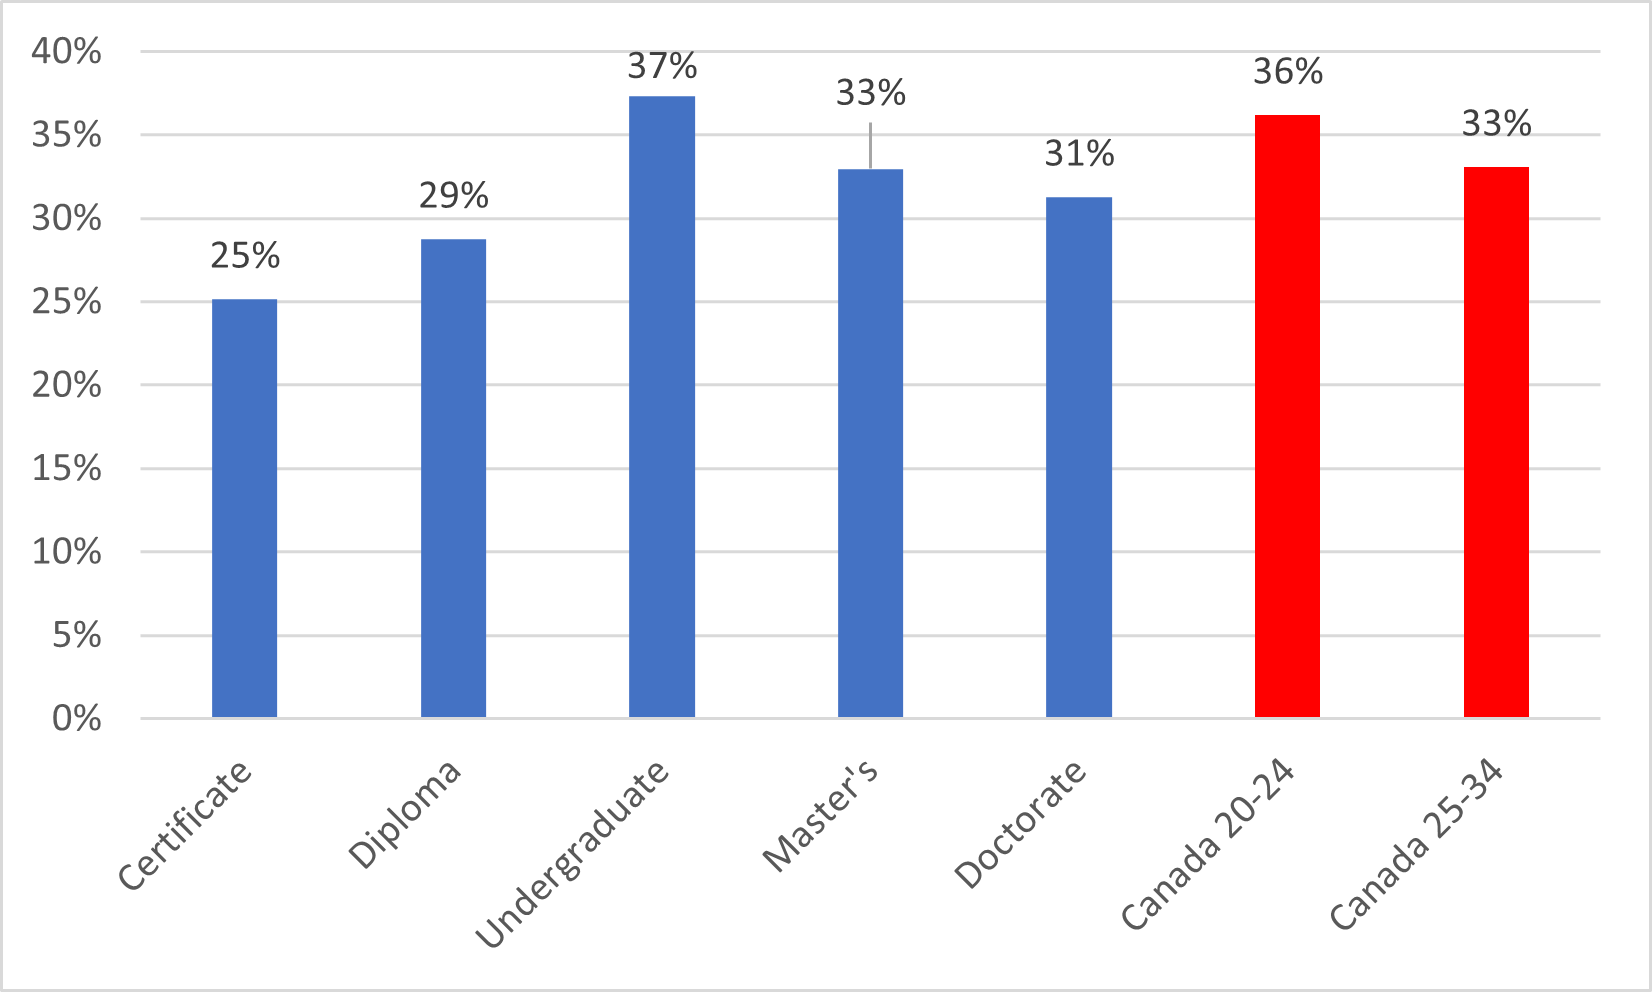
Let’s look first at the percentage of the Canadian post-secondary student body which is visible minority by level of education (figure 1) and compare that to the overall population aged 20-24 and 25-34 for comparison. The highest level is among undergraduates, where 37% of the Canadian student population are visible minorities; the lowest is at the certificate level where only 25% of students are visible minorities. At universities, visible minority students are very slightly over-represented compared to the Canadian population as a whole; at colleges, they are under-represented.
Figure 1: Proportion of student body which is “visible minority”, by level, Canada 2020-21
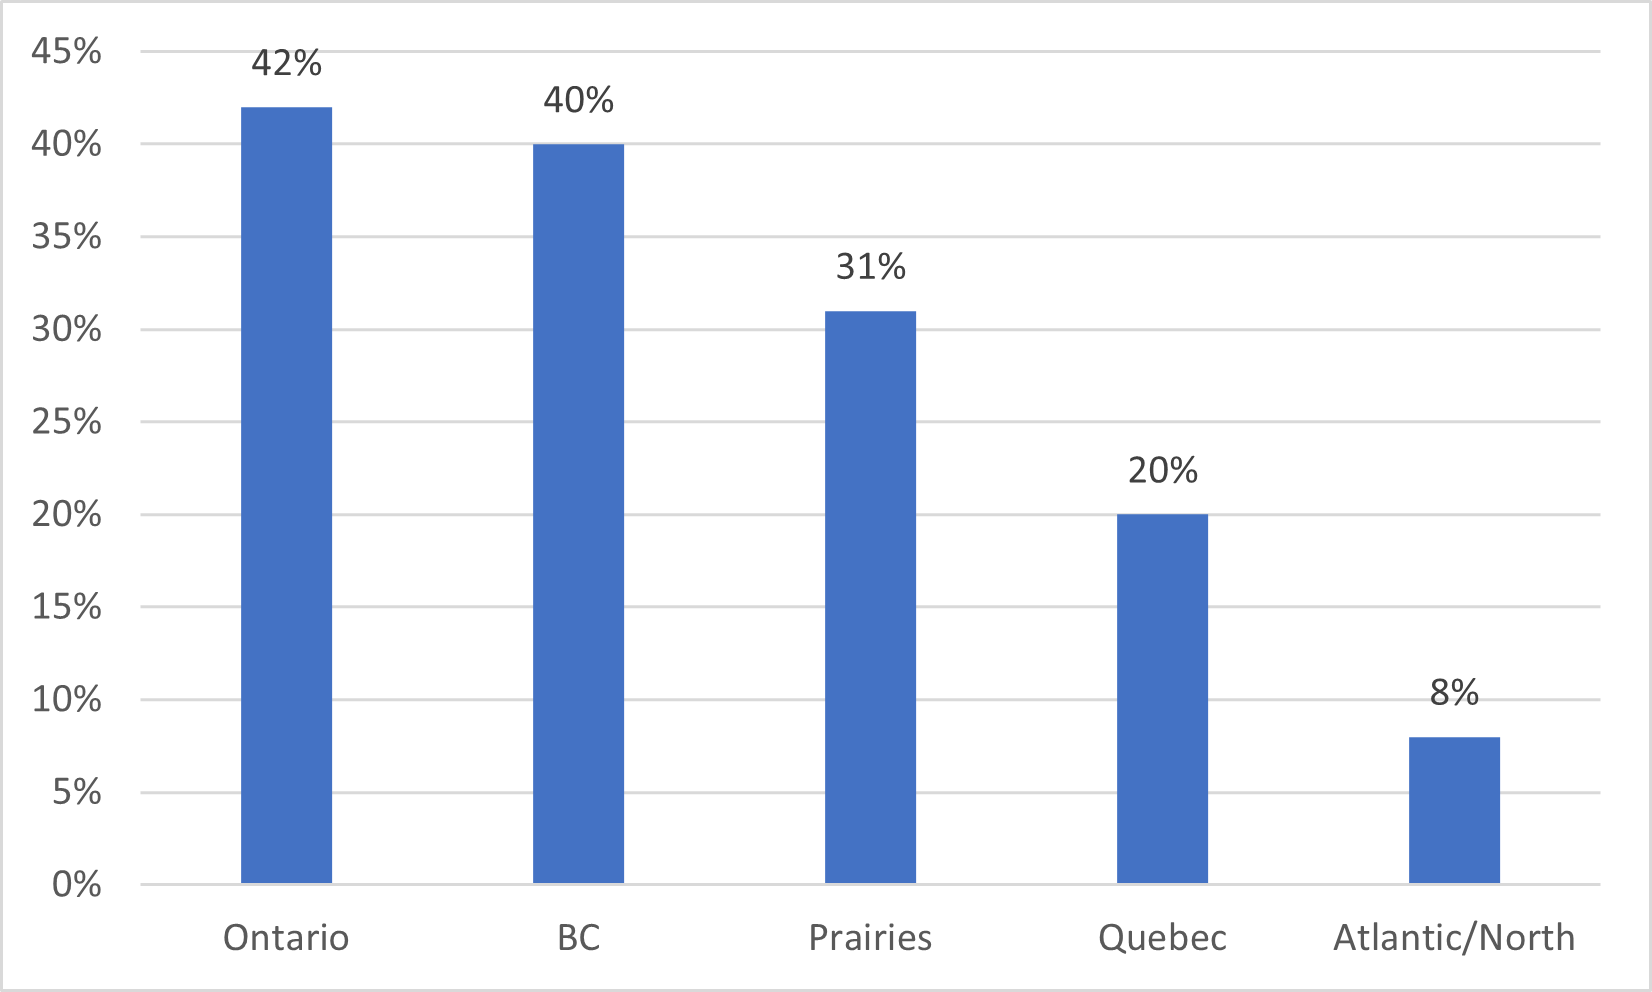
Predictably, the ethnic composition of schools differs quite a bit from one part of Canada to another. Figure 2 shows the percentage of the student body at all levels that is visible minority, by province. Ontario and British Columbia are both at 40%+ plus; but in Atlantic Canada and the North (don’t @ me, these are Statscan’s aggregated categories) it is just 8%. This is largely in line with the distributions of ethnicity among young Canadians as a whole.
Figure 2: Proportion of Students who are Visible Minority by Region, Canada, 2020-21
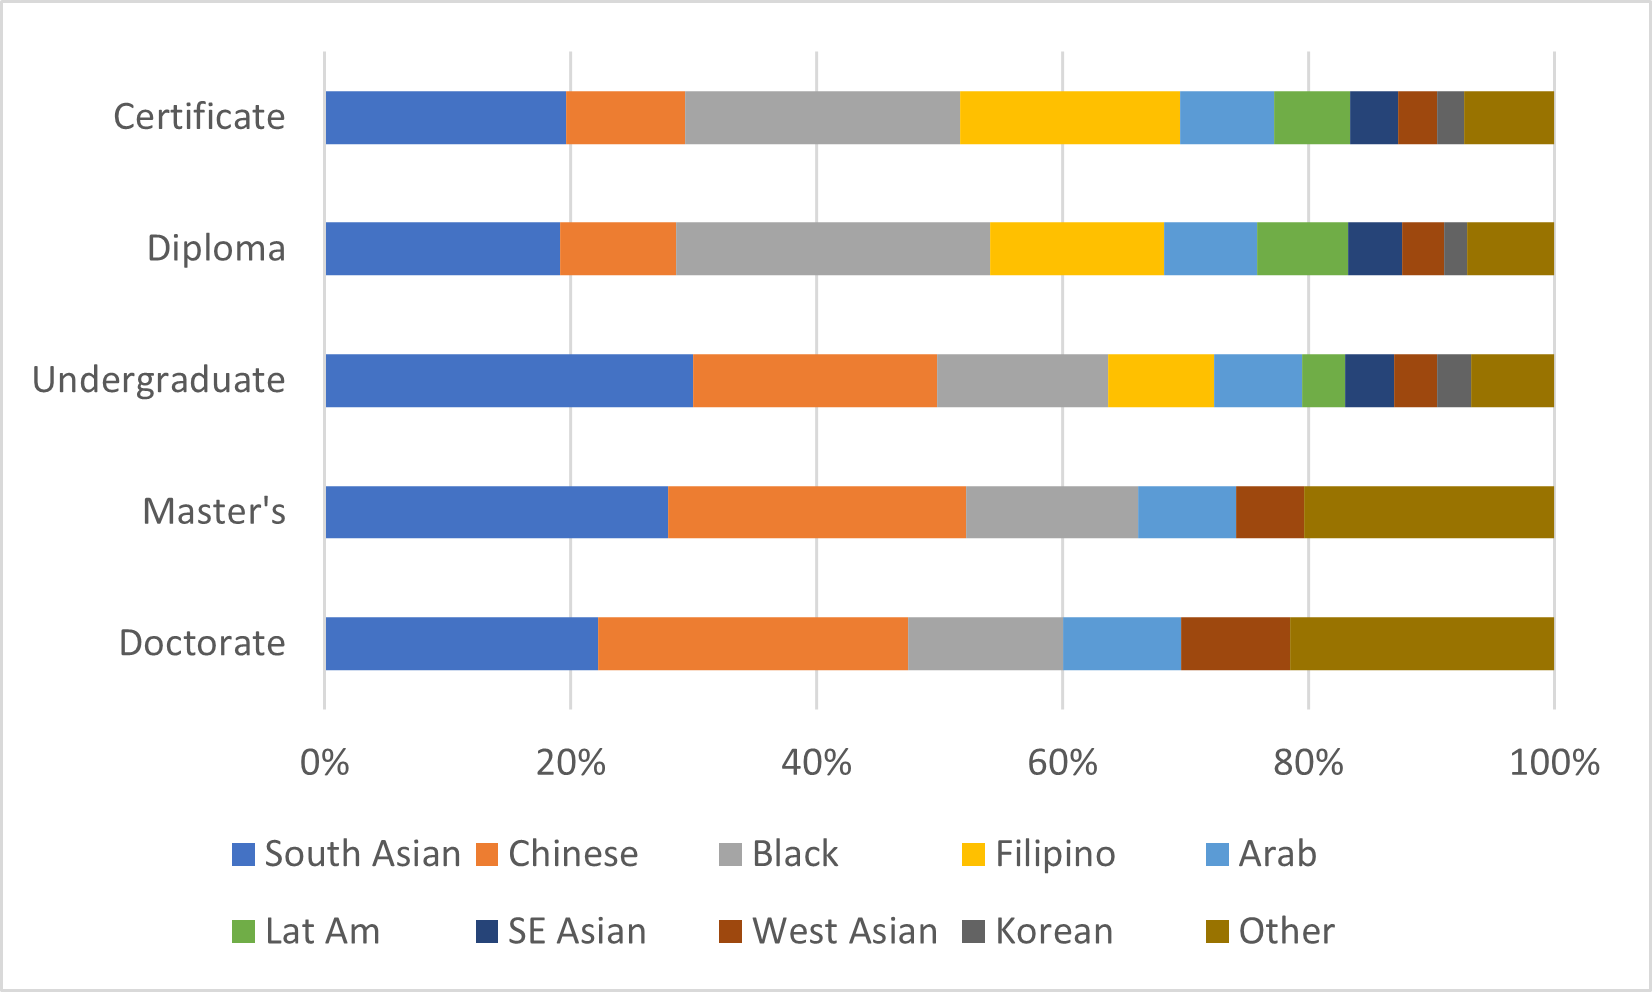
Now what’s really interesting is to get beyond the overarching “visible minority” tag and look at the mix of ethnicities at each level, which is what Figure 3 shows. Broadly speaking, South Asian and Chinese students are over-represented at the university level and under-represented below it, while the reverse is true for Black students. Note that for the Master’s and Doctorate levels, because of small numbers, students who identify as Filipino, Latin American, Southeast Asian and Korean are all amalgamated into the “other” category.
Figure 3: Visible Minority Students by Ethnic Origin and Level of Education, Canada, 2020-21
So, that’s the data Statscan published on Canadian students: how does the data look if you include international students? Well, keep in mind that you can only do this by merging some datasets that aren’t entirely compatible. The data on international students shows country of origin rather than ethnicity, but if we assume that students from Europe and the US = “not visible minority” and students from the rest of the world = “visible minority” (neither of which obviously are literally correct but are nevertheless true within an order of magnitude), then what you get is that 86% of international students at university in Canada are visible minorities while at colleges the figure is roughly 95%. Multiply that out by the respective sectors’ shares of international enrolment at what you get is something like this:
Figure 4: Estimated Proportion of Student Body which is Visible Minority, By Level of Education and Visa Status, Canada, 2020-21

And remember, that’s not including Indigenous students. My guess is that if you add them in and simply look at white/non-white, both sectors are probably running at around 47-48% non-white, or racialized, or whatever other term you would prefer.
Recall that according to a recent-ish Universities Canada report, the proportion of faculty who were racialized/Indigenous was about 22%, based on the 2016 census. Among senior leadership, it was about 11%, based on a 2019 survey. In the last few years, those numbers will both have ticked up a bit, but you’re still likely looking at a situation where the student body is about 2x as likely to be visible minority/Indigenous as the academic staff and roughly 4x as likely compared to senior university leadership.
It’s a heck of a wide gap. I wonder how long it will take to narrow.


3 Responses
Did the Filipino, Latin American, SE Asian, and Korean numbers get subsumed into the “other” category for post-graduate studies, or do those populations mostly just not continue to post-graduate levels?
As Joseph Heath pointed out somewhere I can’t find now, not only does faculty makeup reflect hiring trends of the past but it also reflects the population makeup of the past. While it may be the case that hiring is becoming more representative, it’s certainly the case the the Canadian population of entering students is more diverse than it was in the past.
The above includes two statements about where visible minority students are “over-represented” and “under-represented”. Over and under with respect to what? Is this solely a comparison between the different levels of post-secondary education? That relative proportion is interesting but lacks a base rate. Does the StatsCan data afford a comparison to the representation of visible minorities in the broader populations? That seems like more useful data for post-secondary institutions.
Yes, StatsCan has visible minority populations, broken down by region, gender, age and so one can do that comparison. But the more interesting gaps are with respect to education levels IMO.