Last week, I wrote about college finances. Today I thought I would spend some time updating some of the more interesting graphs I’ve done over the past few years with respect to university finances. I do quite a lot on university finances in HESA’s annual State of Post-Secondary Education, but over the years I have also done some slightly more bespoke takes that don’t make it into SPEC. And so, herewith, my 2024 update on those numbers.
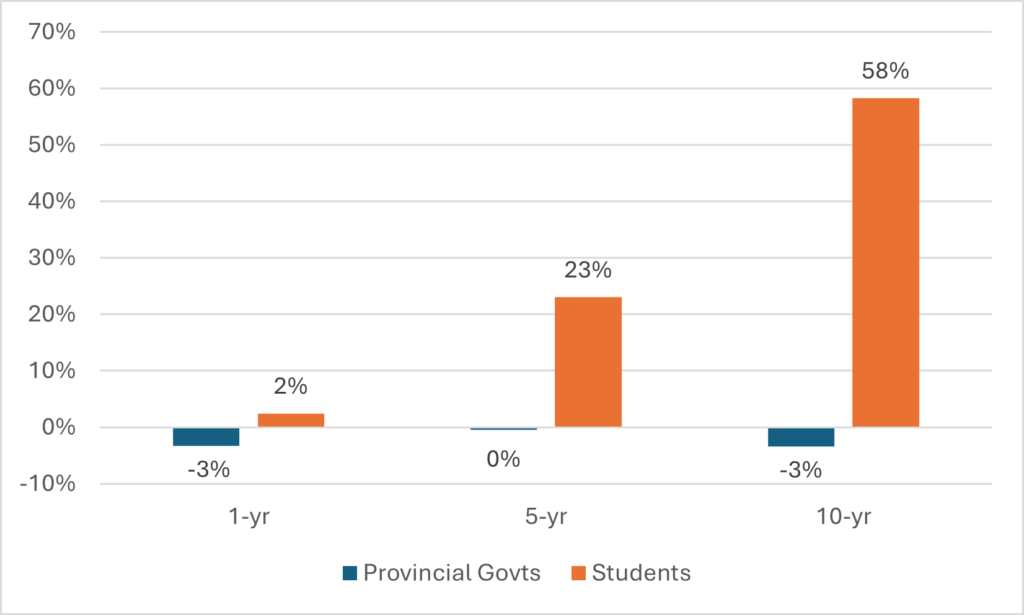
In Figure 1, I look at the changing sources of income by comparing aggregate institutional income for 2021-22 with that of the previous year (2020-21), five years previously (2016-17), and ten years previously (2011-12), after adjusting for inflation. In any given year the numbers don’t do much, but over the space of five or ten years, real change can be seen. Here we see that over a decade the amount universities get from provincial governments has changed very little—in fact it’s down by about three percent (when I do this next year, we’ll see a much bigger fall due to the effects of high inflation in 2022). But income from student fees is up 58%. In fact, these two sources of income are converging so fast, that 2023-24 is probably the year when income from fees alone exceeds provincial government funding.
Figure 1: 1-year, 5-year, and 10-year Changes in Real Revenue by Source, Canadian Universities, 2021-22

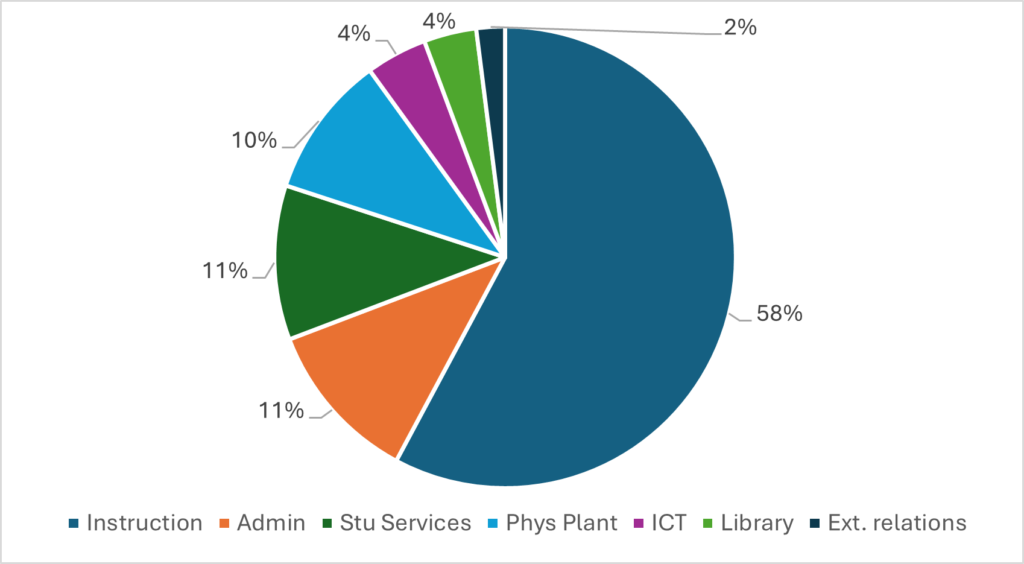
Now, how does that money get spent? Well, Figure 2 shows how money within the operating budget is spent. The bulk of the money goes directly to supporting the educational mission; very broadly speaking, the way Statscan uses the term “instruction” here is functionally equivalent to “money controlled by academic Deans.” Money spent on research is excluded from this calculation because it is considered its own fund in Statscan terms. However, active professors’ salaries are fully included in the “instruction” category, despite the fact that this is not the way we report out salary data internationally when it comes to measuring R&D spending, in which case we attribute roughly 40% of their salaries to research. After that the categories of “administration,” “student services,” and “physical plant” each make up 10-11% of total spending, while ICT, libraries and “external relations” (a category which mainly consists of offices of Advancement and Government/Community relations) collectively make up about 10% of total spending.
Figure 2: Percentage Shares of Total Operating Spending by Function, Canadian Universities, 2021-22

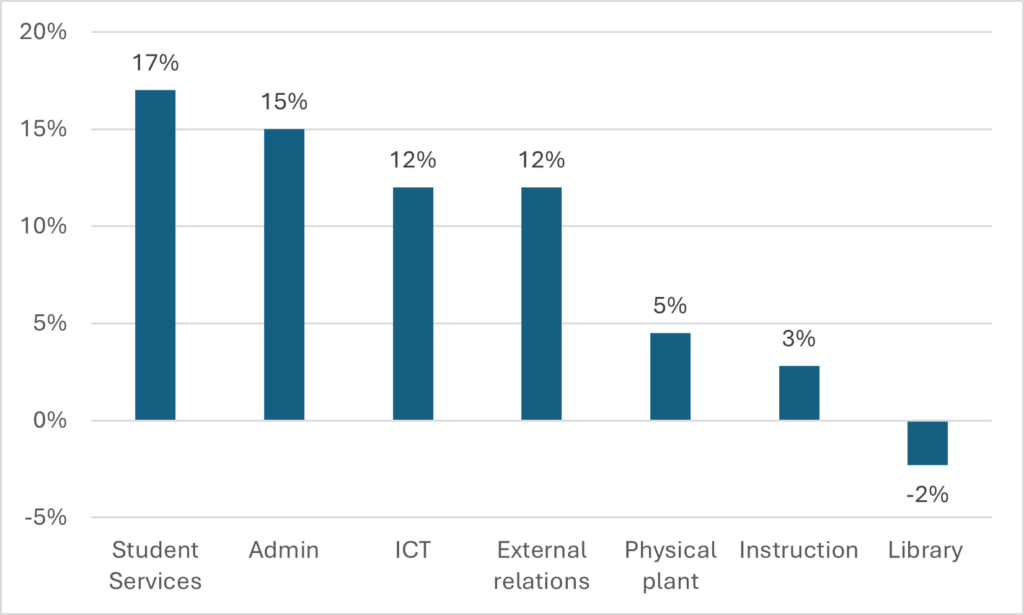
Again, these aren’t the kinds of number where you see change very much from year to year, but over an extended period of time—say, five years—you do see some changes. Figure 3 shows changes in aggregate expenditure in real dollars from 2016-17 to 2021-22. The biggest proportional increases occurred in student services and central administration, though there are also double-digit increases in ICT and external relations. Instruction, on the other hand, has increased by only 3%. One shouldn’t over-interpret these numbers, because the numbers are building on bases of very different size (that 17% increase in student services means that function’s share of total expenditures has grown from 10% to 11%). But it does suggest that institutional spending priorities over the past five years have been on support services rater than on faculties.
Figure 3: Real Change in Spending by Function, Canadian Universities, 2016-17 to 2021-22

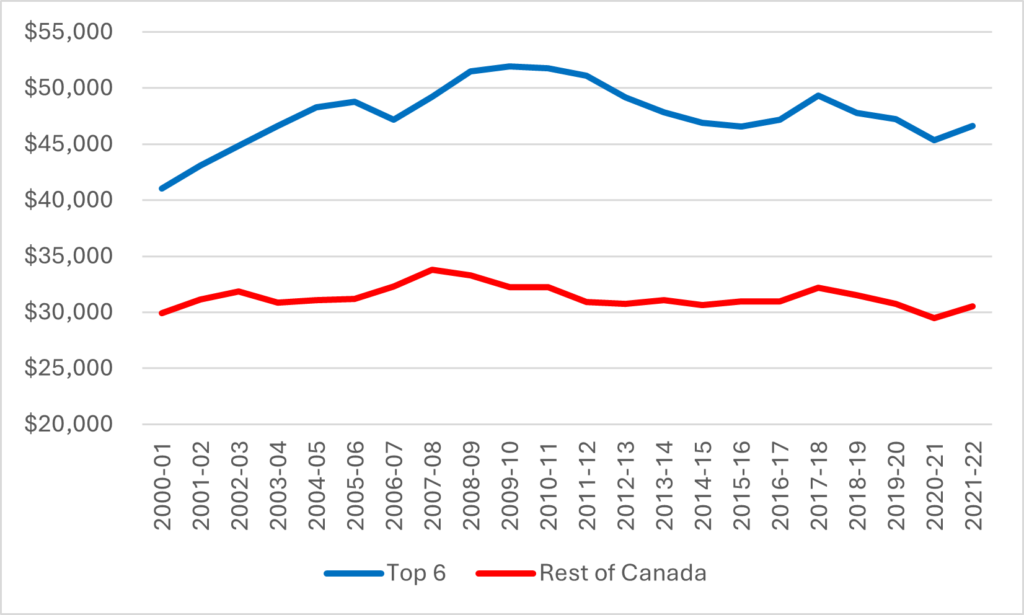
The previous graphs have treated universities as an undifferentiated whole. But some universities have a lot more cash than others. Figure 4 shows per-student expenditures at the six Canadian institutions which regularly come top in the international rankings (McGill, Montréal, Toronto, McMaster, Alberta, and UBC) compared to the rest of the country. As you can see, these institutions on average have budgets which are about 50% higher than the rest. But this has not changed much in the last 20 years. These big universities did get a significant boost in the early 2000s, when the federal government was temporarily taken with the idea of making Canada a research powerhouse, but since then the patterns for top universities and others have been more or less identical.
Figure 4: Per-FTE Student Expenditures, Top Canadian Universities v the Rest of Canada, 2000-01 to 2021-22

Finally, it’s worth just looking quickly at per-student spending differences within the top 6. Université de Montréal stands out as having much lower per-FTE spending than the rest: it somehow manages to crack the global top 200 on a budget not much bigger than the national average (nb. U Montréal figures here include HEC and Polytechnique). Toronto may have a reputation as a rich school, but in fact among the top 6, they are middle of the pack (it may be more important that it is a well-run school rather than a wealthy one). Striking to me at least is the significant decline in spending at the University of Alberta. That’s not just down to government cutbacks: until relatively recently, Alberta was notable for not expanding its student body, which kept per-FTE spending high compared to other schools.
Figure 5: Per-FTE Spending, Top 6 Universities, 2000-01 to 2021-22

And now you’re up to date on university finances!

 Tweet this post
