


Most years, I do a spring round-up of provincial budgets as they relate to post-secondary education. Last year was a wash-out because some budgets didn’t happen until the fall, but this year almost everyone has managed to bring one in more or less on time (the exception being Newfoundland and Labrador, where the budget was delayed by a rather needless election that managed to take about four months to complete). So, today I am going to look at what has happened over the last couple of years and try to paint a picture of Canadian post-secondary finances as we emerge from COVID.
A reminder about how this exercise works. What I am measuring here is what provinces say they are going to spend over the coming year, or cumulative budget commitments. There are always differences – albeit usually small – between what governments say they are going to spend and what they actually spend. I make absolutely no adjustment for this, partly to maintain the purity of the exercise, partly because it usually doesn’t matter that much, but also because I can’t be bothered (this is where I insert the obligatory notice that this is a free blog/email and you get what you pay for). It’s not 100% right, but it’s close, and it’s timely: you don’t have to wait two years for the StatsCan data to catch up.
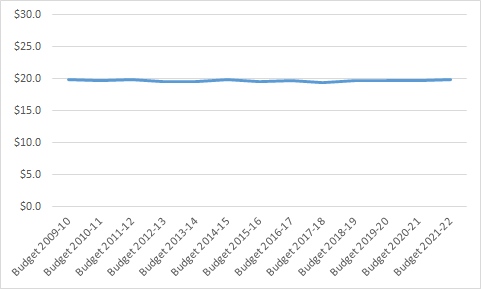
First things first: Figure 1 shows the long-term post-2008 picture in terms of aggregate funding to post-secondary institutions. For all the concerns about underfunding of education and the cries of austerity, actual transfers to higher education institutions have barely changed since 2009. Seriously, you could almost shoot pool on the trend-line here. It’s flatter than Ben Affleck in Pearl Harbour. In a bad year, funding might be $19.4 billion; in a good year it might be $19.9 billion (all terms inflation adjusted, obviously, because I am not a monster).
Figure 1: Aggregate Provincial Transfers to Post-Secondary Institutions, in Billions of $2021.
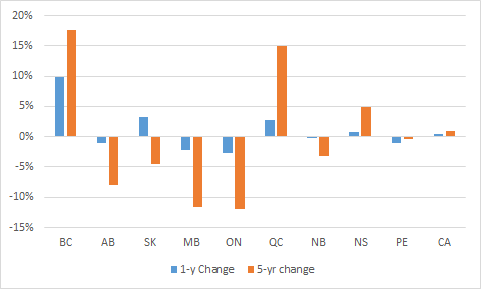
Now, this doesn’t mean that there are no changes in provincial funding. In fact, it’s pretty clear that there are a lot of ups and downs at the provincial level –they just don’t happen in a co-ordinated fashion. In the last few years, for instance, we are seeing significant drops in funding in Alberta, Ontario, and Manitoba but at the same time we are seeing offsetting increases in Quebec and British Columbia (notably, these are the two provinces which have traditionally had the strongest demonstrated commitments to balanced budgets). Figure 2 shows changes over 1 and 5 years, with Newfoundland excluded because its budget has not yet been delivered. And yes, universities and colleges in BC had a really good year this year.
Figure 2: Real Change in Funding to Institutions, over 1- and 5-years, by Province, 2021-2022
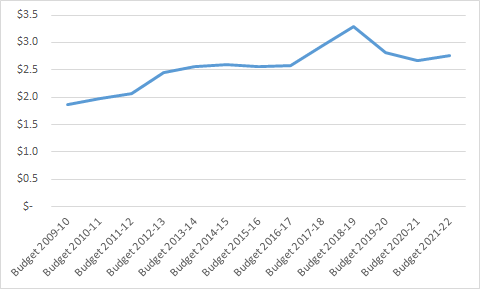
Now let’s move over to student aid spending, which is a somewhat more fraught exercise because the difference between budget and actual can be huge. In Ontario for instance, the late Wynne governments routinely under-budgeted for student aid; in contrast in 2020, Ontario massively over-budgeted for student aid (that is, what was given out was about a half-billion short of what was budgeted mainly because of the how federal government’s expenditure of a couple of billion dollars into student aid partially displaced and thus reduce provincial expenditures). But still, some long-term analyses are useful. As shown below in Figure 3, the real value of student aid expenditures is up about 45% over where it was just after the great financial crises, though still off its 2017-18 peak of $3.2 billion when the Wynne government was pouring money into OSAP like there was no tomorrow.
Figure 3: Aggregate Provincial Expenditures on Student Financial Assistance, in Billions of $2021.
I’ll spare you the province-by-province analysis here, mainly because provinces are hugely inconsistent from one year to the next about how student aid gets treated in government estimates (Manitoba, for instance, appears to have increased its student aid spending by about 60% in the last two years, and while provincial expenditures on the Manitoba Bursaries Initiative are indeed up, I am pretty sure about that about 2/3rds of that “increase” is just a change in reporting). The one thing of interest is that since 2015-16, student aid expenditures in Quebec have risen by only about 10% ($80 million) while transfers from the federal government in respect of its opt-out from the Canada Student Loans Program are up by considerably more than that. I’m pretty sure that the student unions in Quebec will work this out pretty soon, and then look out (though the Legault government could quite legitimately point out that as a government it has a better record than any government since Bourassa’s in terms of funding institutions).
In any event: if you’re a glass-half-full person, you can look at this and say, “no erosion of funding, and improved student aid, what’s the problem”? If you’re a glass half-empty type, you could decry the lack of funding increases and the fact that tuition increases over the past decade have probably eaten all the increases in student aid (I haven’t done the math on it, but I think that’s about right). It works either way.
But if you’re a realist, you should look at these numbers and say: enjoy it while you can. The post-COVID reconstruction in public finances is going to make numbers like these hard to maintain.


4 Responses
Have the number of domestic students increased in that time? If so, this would still represent a loss of funding per student.
Canada’s population is aging, so the number of university age students has been on the decline since 2011.
POPULATION OF 15-19 YEAR OLDS IN CANADA
2011: 2,239,000
2016: 2,053,000
2021: 2,035,000 (estimated)
Enrolments are different than population size since they depend on participation rates, foreign students, and other factors. Here they are for universities up to 2019. Also, programs vary in cost. Graduate and STEM enrolments will be higher, for example. Finally, inflation is a generic index and not specific to the cost of running PSE institutions.
https://www.statista.com/statistics/447814/university-enrollment-in-canada/
Domestic university enrollments peaked at 869k in 2013/2014 and levelled off to about 860k in 2018/2019 (pre-pandemic). International student enrollments have increased from 64k in 2010/2011 to 114k in 2018/2019.
SOURCE: Postsecondary program enrolments and graduates: Interactive tool (StatsCan)
https://www150.statcan.gc.ca/n1/pub/71-607-x/71-607-x2020019-eng.htm