


Some interesting trend data to review from Ontario today.
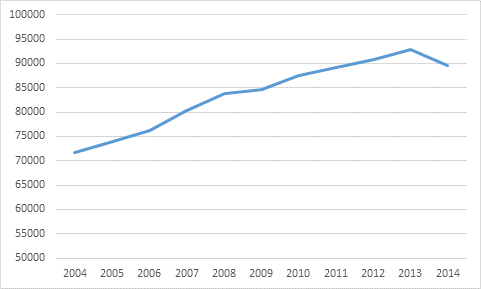
First, there’s the fact that applications from secondary schools have dropped by 3% this year, from 92,892 to 89,609 (as of the February snapshot, which for most purposes is as good as the final numbers, since something like 95% of all applicants apply before the end-of-January line). This is a moderately big deal since it’s the first time since the double cohort that numbers have fallen.
Figure 1: Applications from Secondary Schools by Year, Ontario, 2004-14
Some university officials have waved this away as being a result of declining population, but there’s no evidence that the population of 18 year-olds has fallen by 3%. Statscan hasn’t published data for 2014 yet, but between 2010 and 2013 the number of 18 year-olds actually increased by 2%, even though the agency’s population projections had suggested their numbers would fall somewhat. In the chart below, which shows the ratio of secondary school applicants to 18-year-olds over time, I average Statscan’s projection with the actual annual increase for the past four years, and assume a fall of 1.6% in 2014. So even accounting for population change, university applicant numbers are still down.
Figure 2: Applications from Secondary School as a Percentage of 18-Year-Olds, Ontario, 2004-14
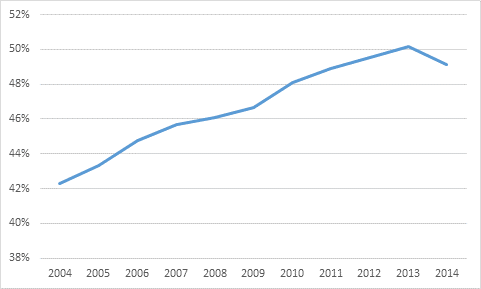
The fact that the percentage of 18 year-olds attending Ontario universities has fallen is notable, but we shouldn’t overstate the implications. In the first place, it hasn’t fallen far – just back to where it was in 2012. Second, these numbers are only for Ontario applicants; they don’t include all the many international students whose numbers are still rising. Fact is, most institutions will be OK for awhile yet.
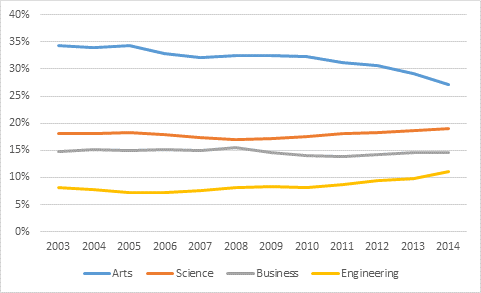
More interesting, perhaps, is what’s going on with applications by field of study. Check out, for instance, what’s happening with the “big four” fields, which account for slightly over 70% of all enrolments. Applications to Arts subjects have been falling for some time; in 2003, 35% of all applications were to Arts Faculties, now it is just 27% (albeit of a much larger applicant pool – in absolute numbers they are about where they were in 2003). Science and Business have more or less kept their share of enrolments steady over time, while Engineering has seen its share grow from 8% to 11%. That might not sound like much, but in absolute terms it represents an increase of 81%, from 5,515, to 9,984.
Figure 3: Arts, Science, Business, and Engineering Applications as Percentage of Total, Ontario, 2004-14
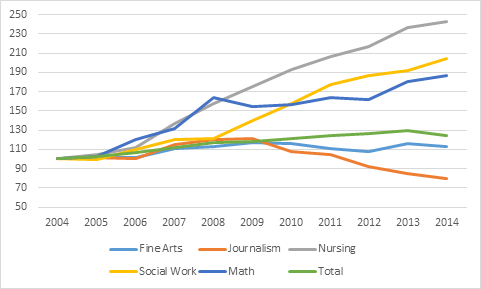
But look a little more closely at the data, at some of the smaller fields of study, and you can see some really amazing shifts in numbers. Nursing, by some distance, is the “hot” discipline (not surprising, given the 100% placement rate and the $50K plus starting salaries), with applications increasing by close to 150%. Social Work has seen applications double, and Math applications are up almost 90%. Fine Arts applicant numbers have stayed very stable over the past decade; only Journalism has seen a major negative shock, with applications down by over a third from their 2008 peak.
Figure 4: Changes in Application Numbers, Selected Fields of Study, Ontario, 2004-14, Indexed to 2004
The disciplinary enrolment shifts are of significantly more importance than 1-year changes in total enrolments. They show that, over time, students do in fact respond to changes in labour market conditions, but that it may take a few years for the response to be evident. Quite properly, students might want to see sustained evidence of change before committing to a different field of study. And that’s a good thing, whatever the usual Labour Market whiners might say.

