


Let me tell you a sad story about Ontario colleges.
In 2018-19, Ontario colleges got a huge influx of extra public money, about $120 million or so, or a bump of about 7%. I’m not exactly sure why – suspect a lot of it was money pushed out the door in the waning months of the Wynne administration. But then times changed. In 2019-20, government transfers to Ontario colleges fell by 10%. And on top of that, the government slashed domestic tuition fees by 10%.
OMG! Must be a disaster, right? How can they cope with all this woe? Well…
Allow me to introduce Figure 1, which shows the net surplus as a percentage of total revenue statement for every college in the province for 2019-20 (minus Sheridan, which has yet to post its financials).
Figure 1: Net Surplus as a Percentage of Total Revenue, Ontario Colleges, 2019-20
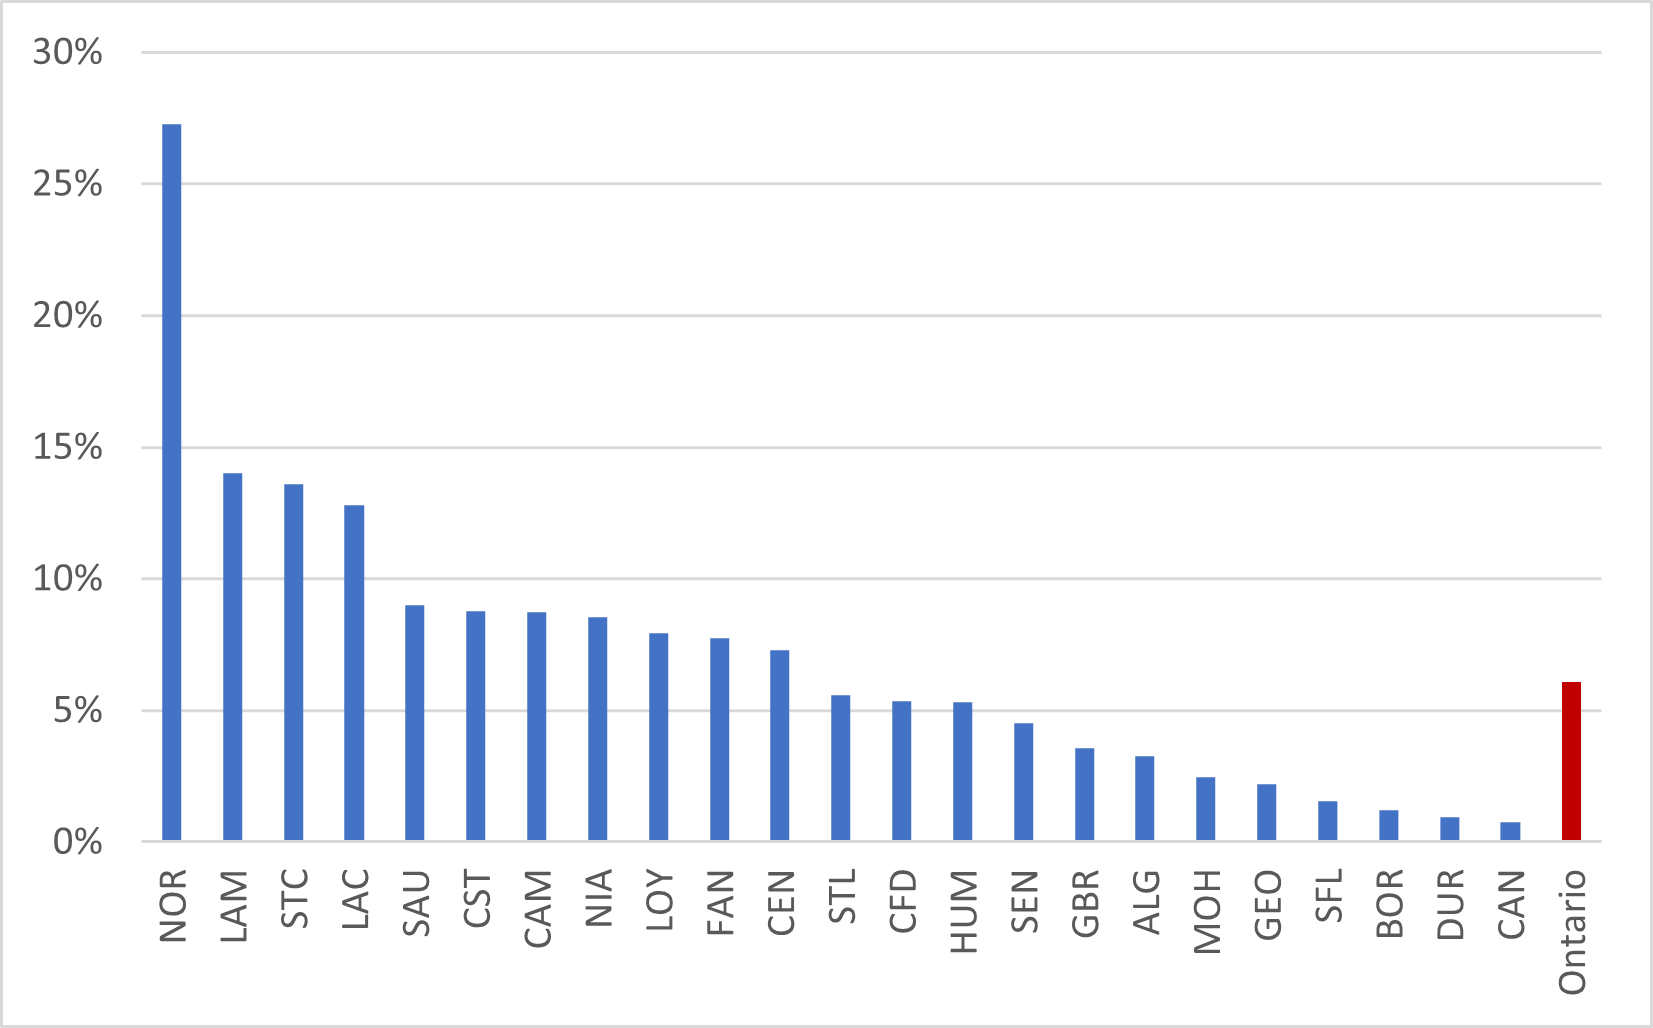
Got that? Cuts in its two main sources of revenue, and everyone is still in the black. System-wide, the surplus is 6.1% of revenues, but it is over 10% at La Cité, St. Clair, Lambton and over 25% at Northern (those last three all being the proud owners of some of those GTA satellite campuses I’ve mentioned before).
How is this possible? Well, the thing is domestic students aren’t a major source of revenue anymore. It’s all about the international students. Not many schools break out the revenue of the two, but at the few who do, international students are often 80% or more of the total pie; even at Confederation College in Thunder Bay, which (let’s face it) is not the first place you think of when you think “magnet for foreign talent”, international student fees are 64% of the total.
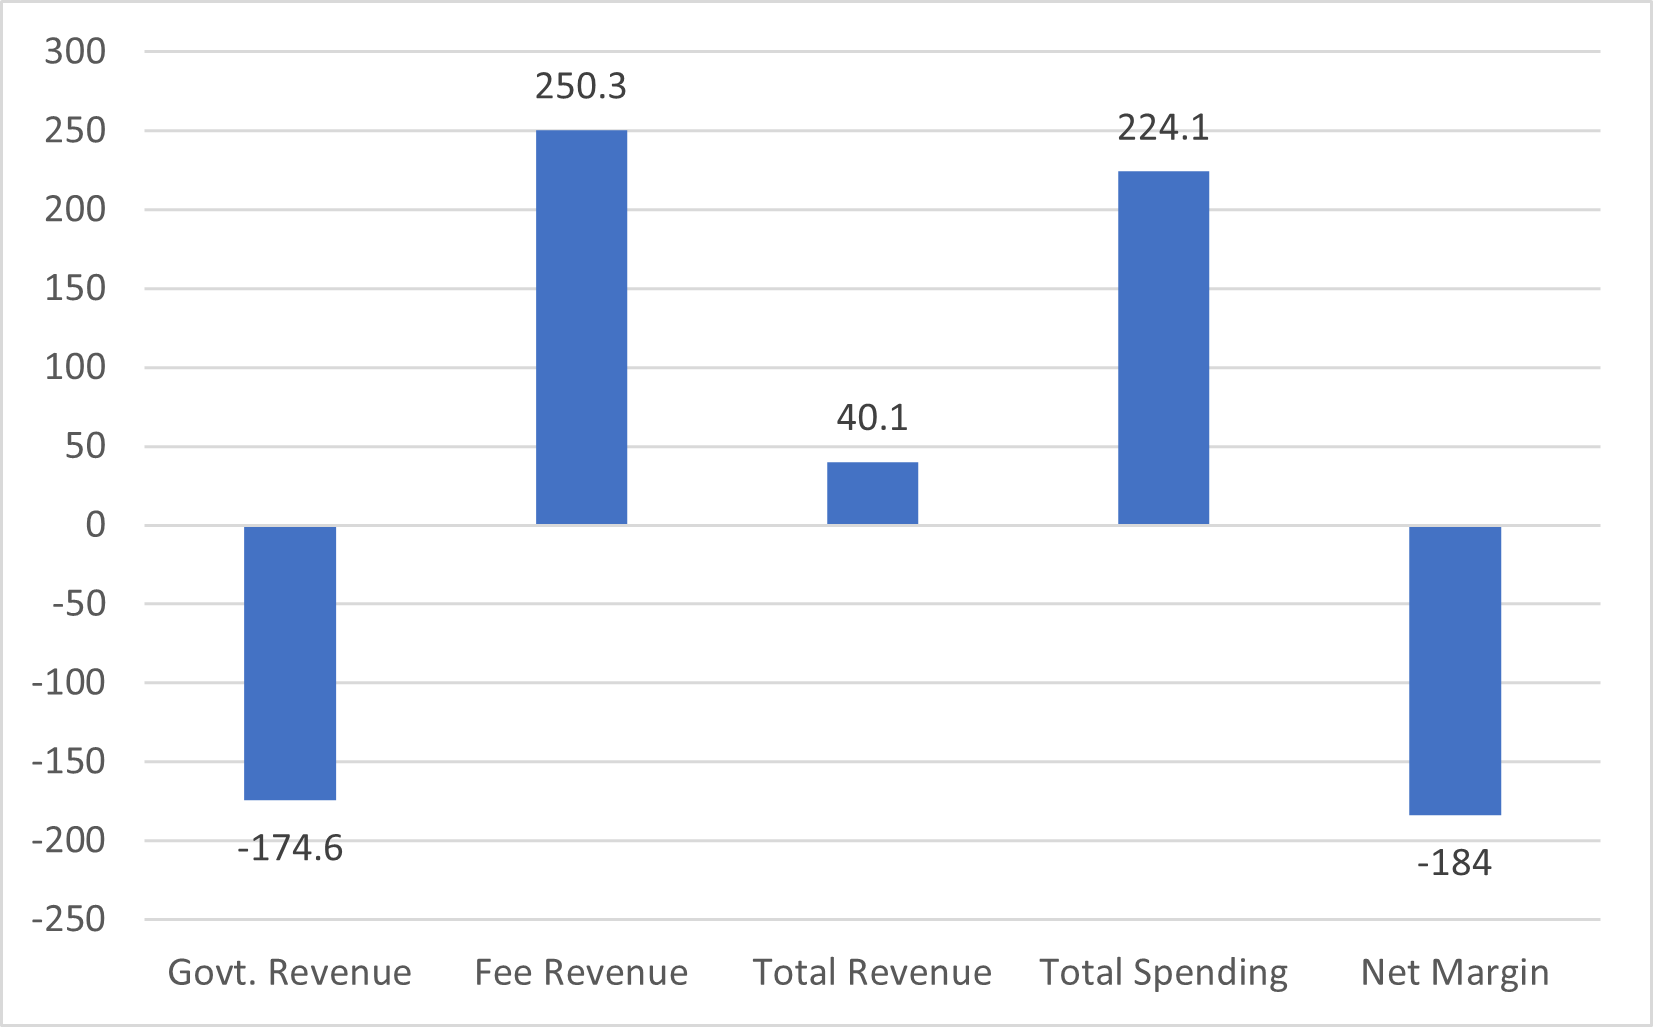
Figure 2 shows what changed, system-wide between 2018-19 and 2019-20. Government revenue fell by about $175 million, but this was offset by an increase of just over $250 million in revenue from fees (remember, this in a year when there was a 10% domestic tuition cut). Total income was up slightly, but a 5% rise in nominal spending ($224 million) meant margins fell by $184 million, bringing gross margins down from a stratospheric 9.8% to a merely very healthy 6.1%.
Figure 2: Aggregate One-year Change in Revenue/Spending, in Millions, Ontario, 2019-20
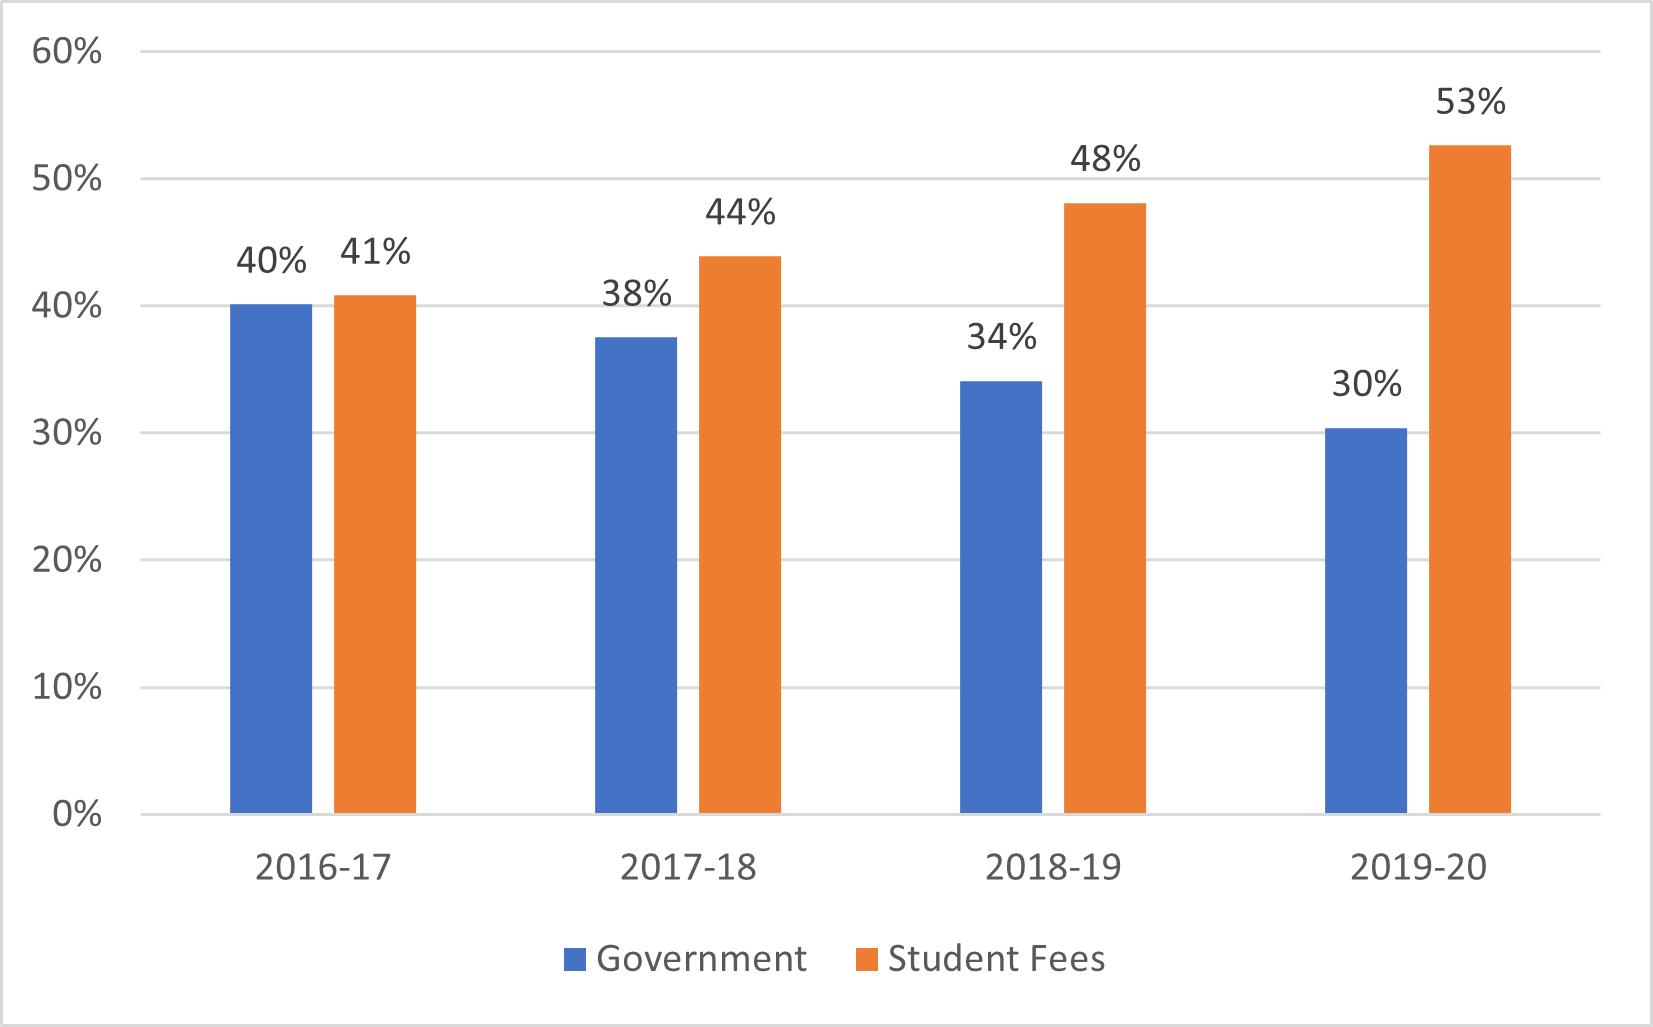
The wave of international student tuition means that Ontario colleges are ever-likelier to be majority-funded from private sources. Just four years ago, student fees and government support were roughly equal sources of revenue for Ontario colleges (the remainder of the income comes from other private sources – ancillary operations, contract training, etc). Now, 53% of the Ontario system comes from fees, and only 30% from government. In fact, simple math tells us that if only 56% of the system’s tuition fees come from international students, then Ontario colleges would be getting more money from international students than from Queen’s Park. And again, while we don’t have that domestic/international breakdown for most schools, I’m going to go out on a limb and say: if Confederation College is at 64% then I am damn sure the system is over 56%.
Figure 3: Proportion of Total Revenue from Selected Sources, Ontario Colleges, 2016-17 to 2019-20
I am fairly sure that this degree of reliance on student fees for the operation of a community college system is unparalleled anywhere in the world. Just for giggles, I decided to compare Ontario’s college funding arrangements against some of the reddest, Trumpiest jurisdictions in the US, places where you would assume predatorial funding policies exist. What I found was quite interesting: turns out those states are very highly publicly funded: none received less than 68% of their funds from government, more than twice the proportion of Ontario.
Figure 4: Proportion of Total Revenue by Source, Selected Jurisdictions, Latest Year Available
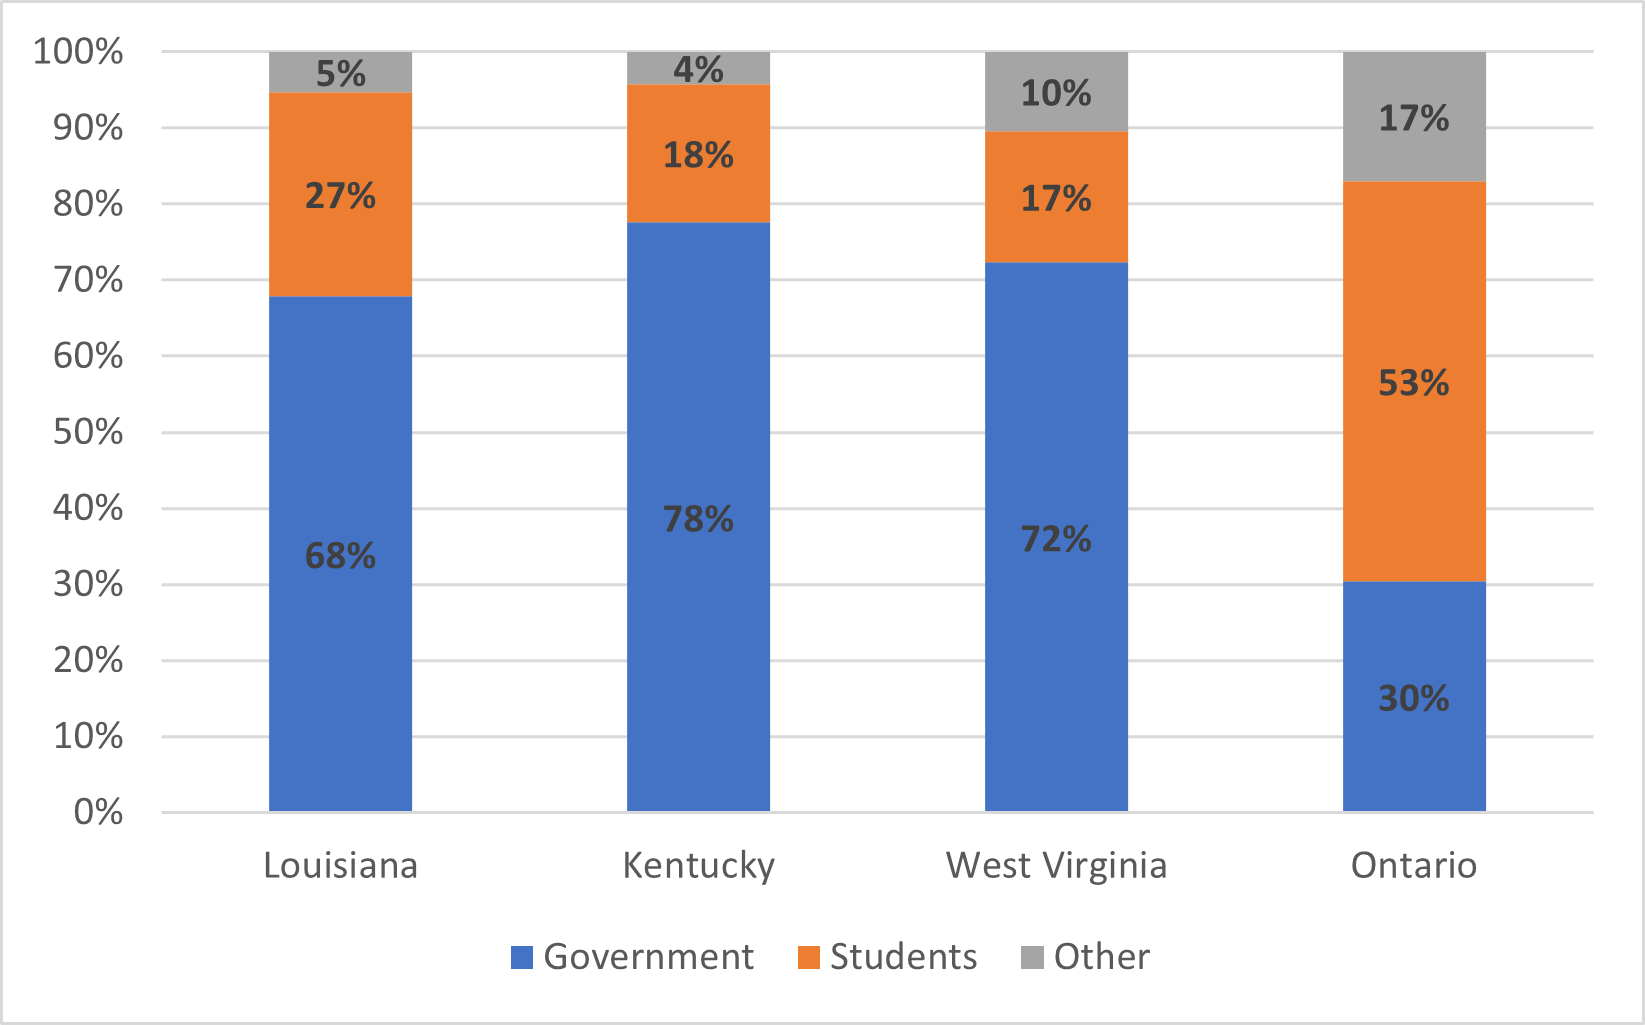
(Slight caveat: the federal government appropriates directly to community colleges in the US in ways I do not completely understand, but which are nevertheless very significant – 56% of all government transfers in Louisiana. In Ontario it’s about 2%, maybe.)
Now this isn’t necessarily a fair comparison because we are looking at proportions, not totals. Maybe all that private money is delivering a better product! So I took the various sources of income, divided them by Fall FTE enrolment, and adjusted the US spending into Canadian dollars using the Purchasing Power Parity method ($1 Canadian = $0.83 American). The result is shown in Figure 5.
Figure 5: Revenue by Source per Fall FTE student, Selected Jurisdictions, Latest Year Available
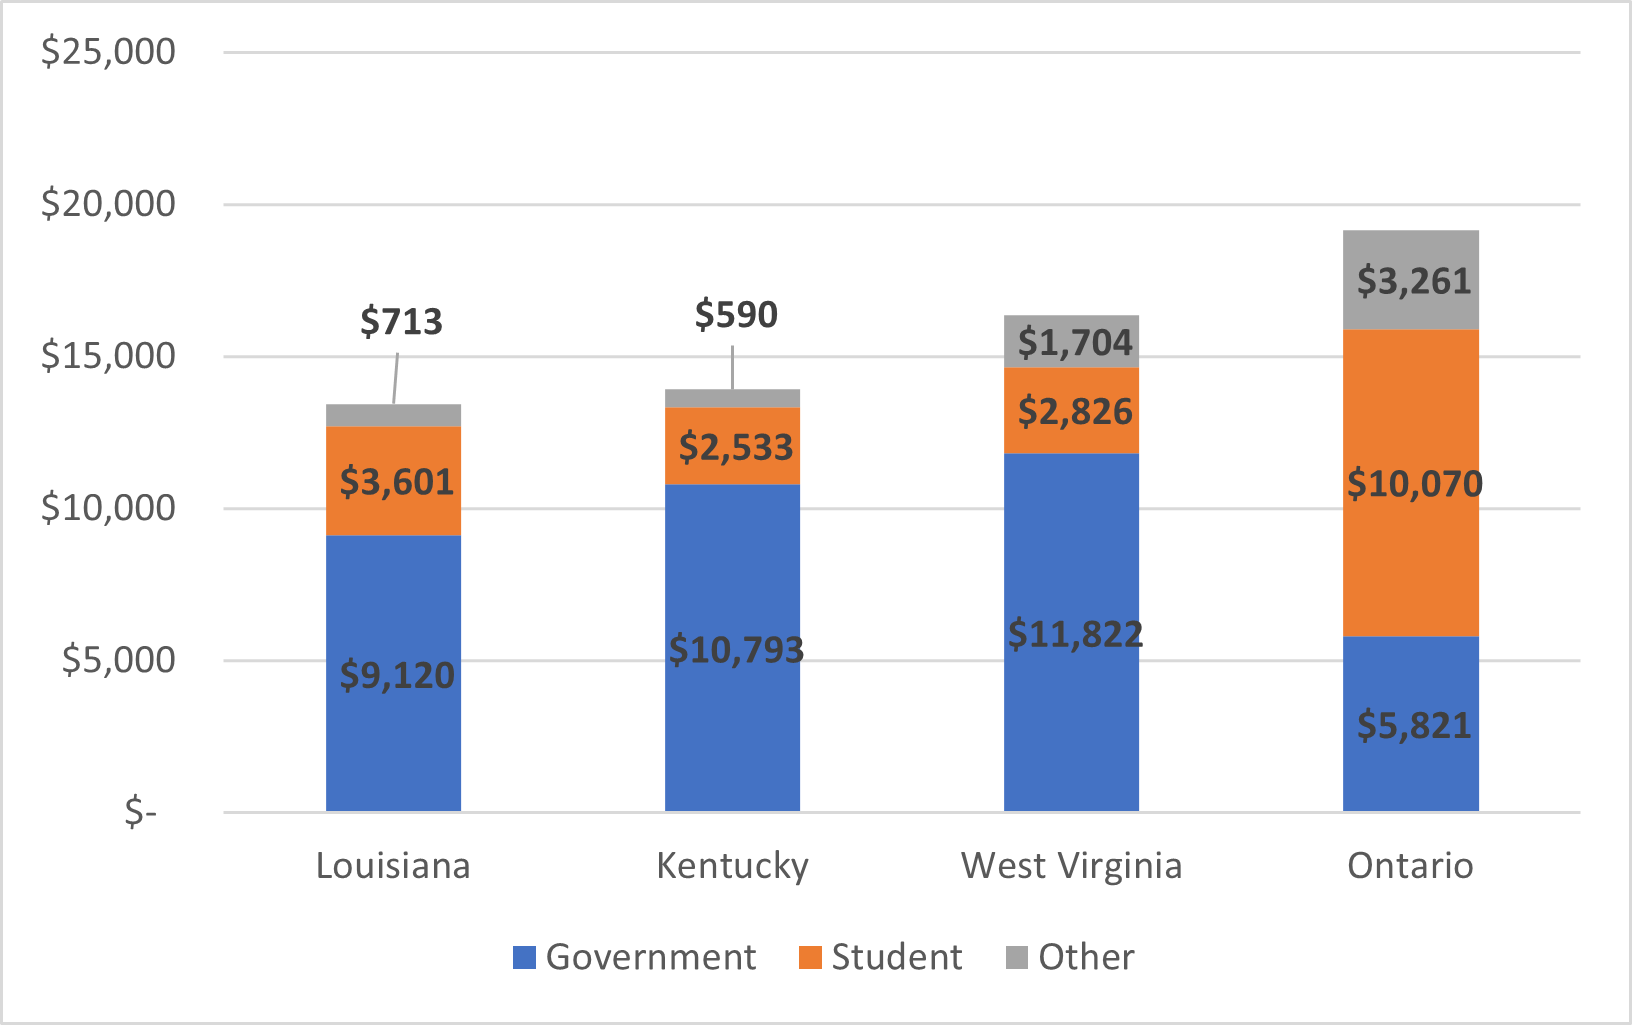
Figure 5 is not a perfect comparison because I am pretty sure differences in attendance patterns and differences in the way FTE is calculated mean that this calculation is a bit generous to the United States, but nevertheless I think the overall picture is clear enough: Ontario colleges are better off than those in the poorest, reddest, Trumpiest states, but it’s entirely because of international student fees. Take out the extra $6500/FTE those students provide, and Ontario looks a lot like Kentucky and Louisiana, only with much weaker public funding.
In sum, Ontario colleges have convinced the Asian (largely Indian) middle class to make up for decades of the Ontario government’s crass neglect in public funding. As I say, it’s a miracle. Wonder if it will last?


2 Responses
Table 1 might tell a different distributional story if adjusted to show “northern, rural, small” college grants. The original benchmark for access to these special purpose grants was population density, which is not systematically re-calibrated and, as you correctly say, its basic premise has been overtaken by international enrolment. CARDF might also explain some of the funding story. CARDF is not really a research fund; it is an operational development fund. But at around $20M it probably is not big enough to make a major difference in Table 1.
The American colleges are educating and training local people; the Ontario colleges are running a business educating and training foreign people.