


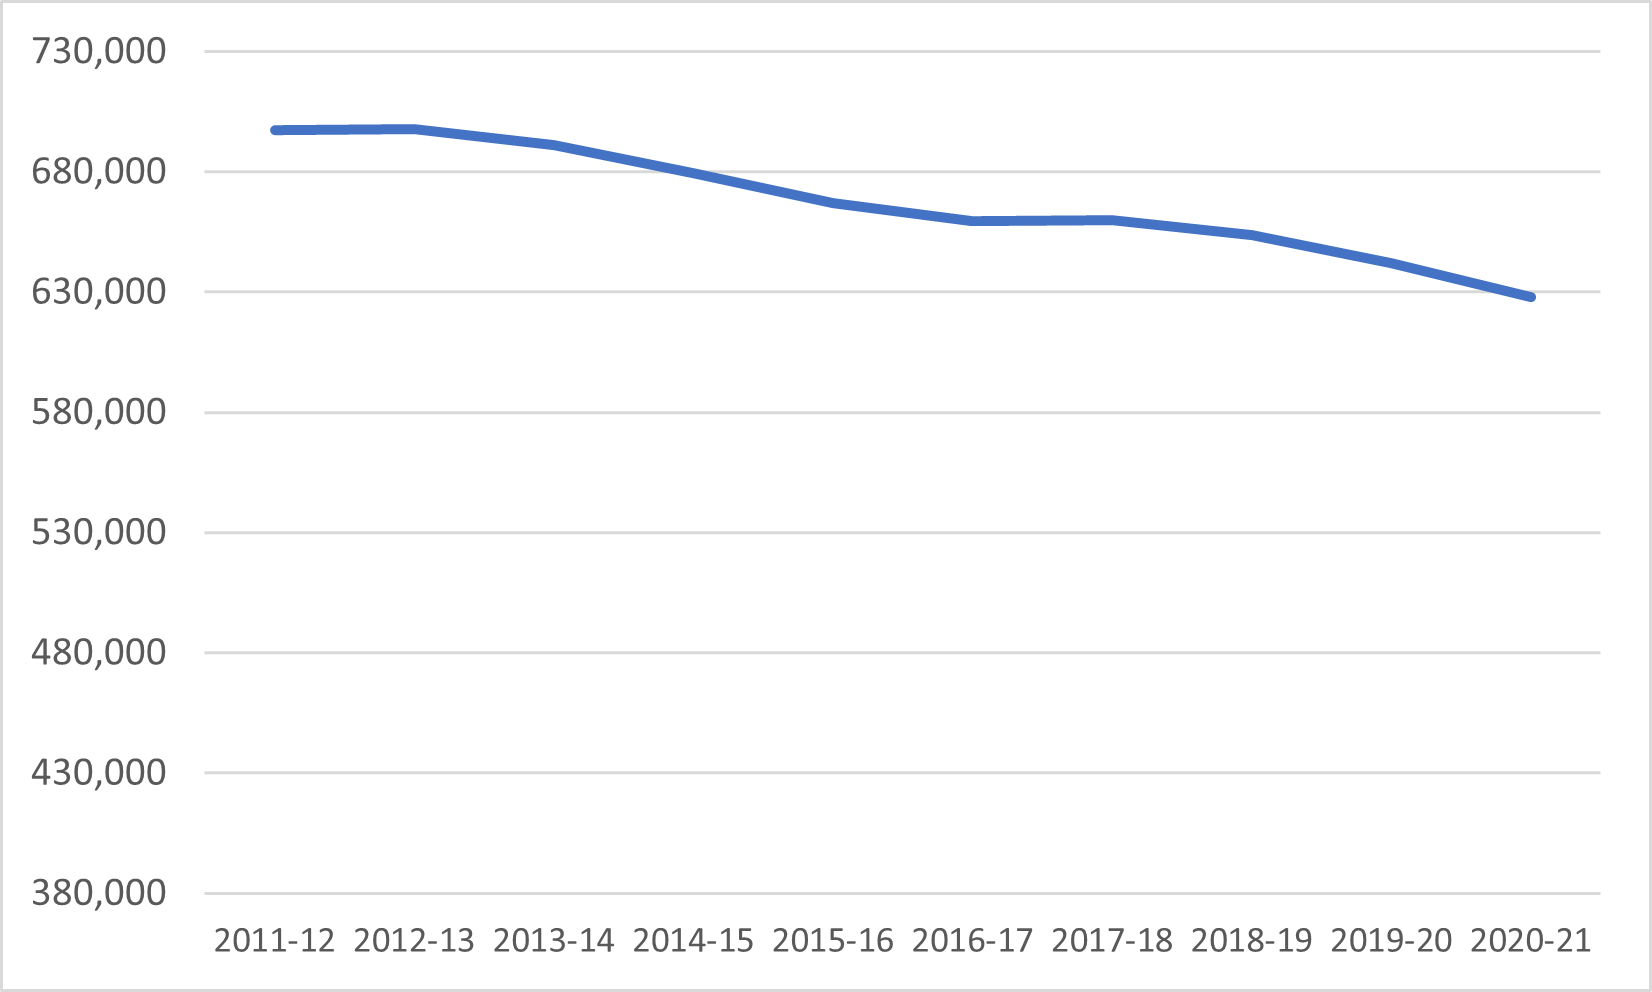
One thing that’s been quite clear for awhile is that the Canadian community college sector has been seeing a decline in domestic enrolments for the better part of a decade. Peak domestic community college enrolment was in 2012-13: by 2020-21 numbers were already down by over 10% and my understanding from chatting with people across the country is that domestic numbers have continued to decline in the past two years, quite substantially in some cases. Obviously, many colleges have found ways to offset these declines with more lucrative international students, so this trend isn’t exactly an existential threat, but it is an intriguing one.
Figure 1: Domestic Students Enrolled in Community Colleges, Canada, 2011-12 to 2020-21
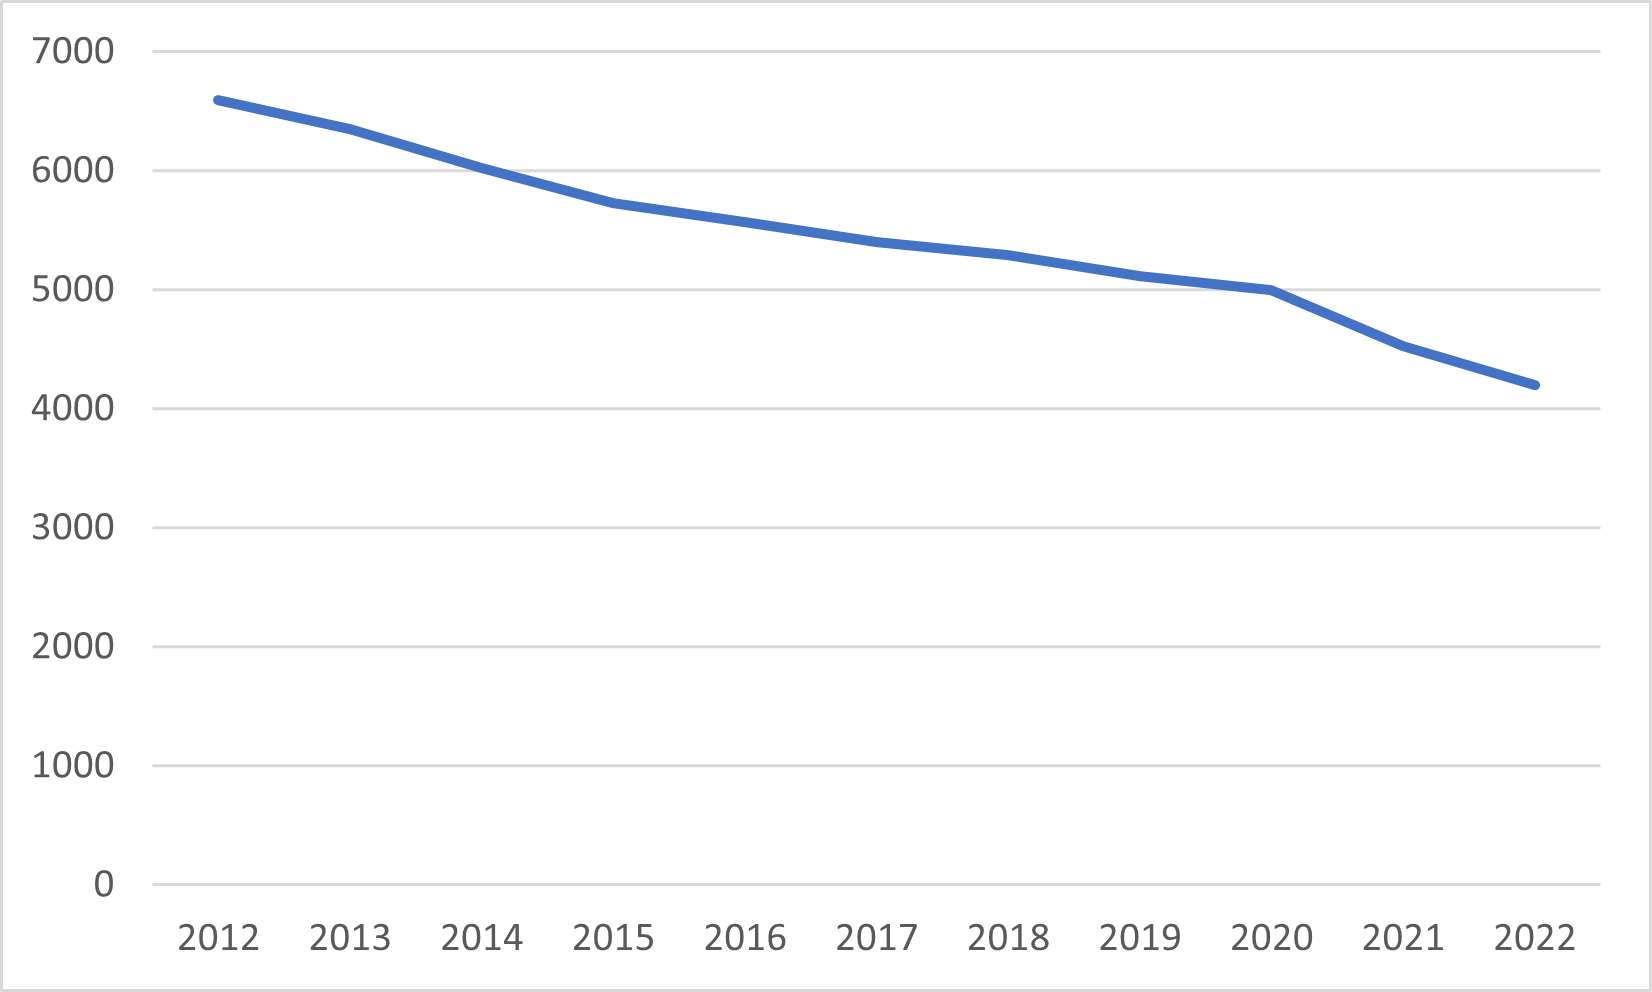
This trend isn’t unique to Canada; we’re seeing pretty similar numbers around the world. Take community colleges in the United States, for instance. According to data from the National Clearinghouse, community college enrolment in 2022 is down by a whopping 36% from where it was a decade ago.
Figure 2: Community College Enrollment in Thousands, United States, 2012-22
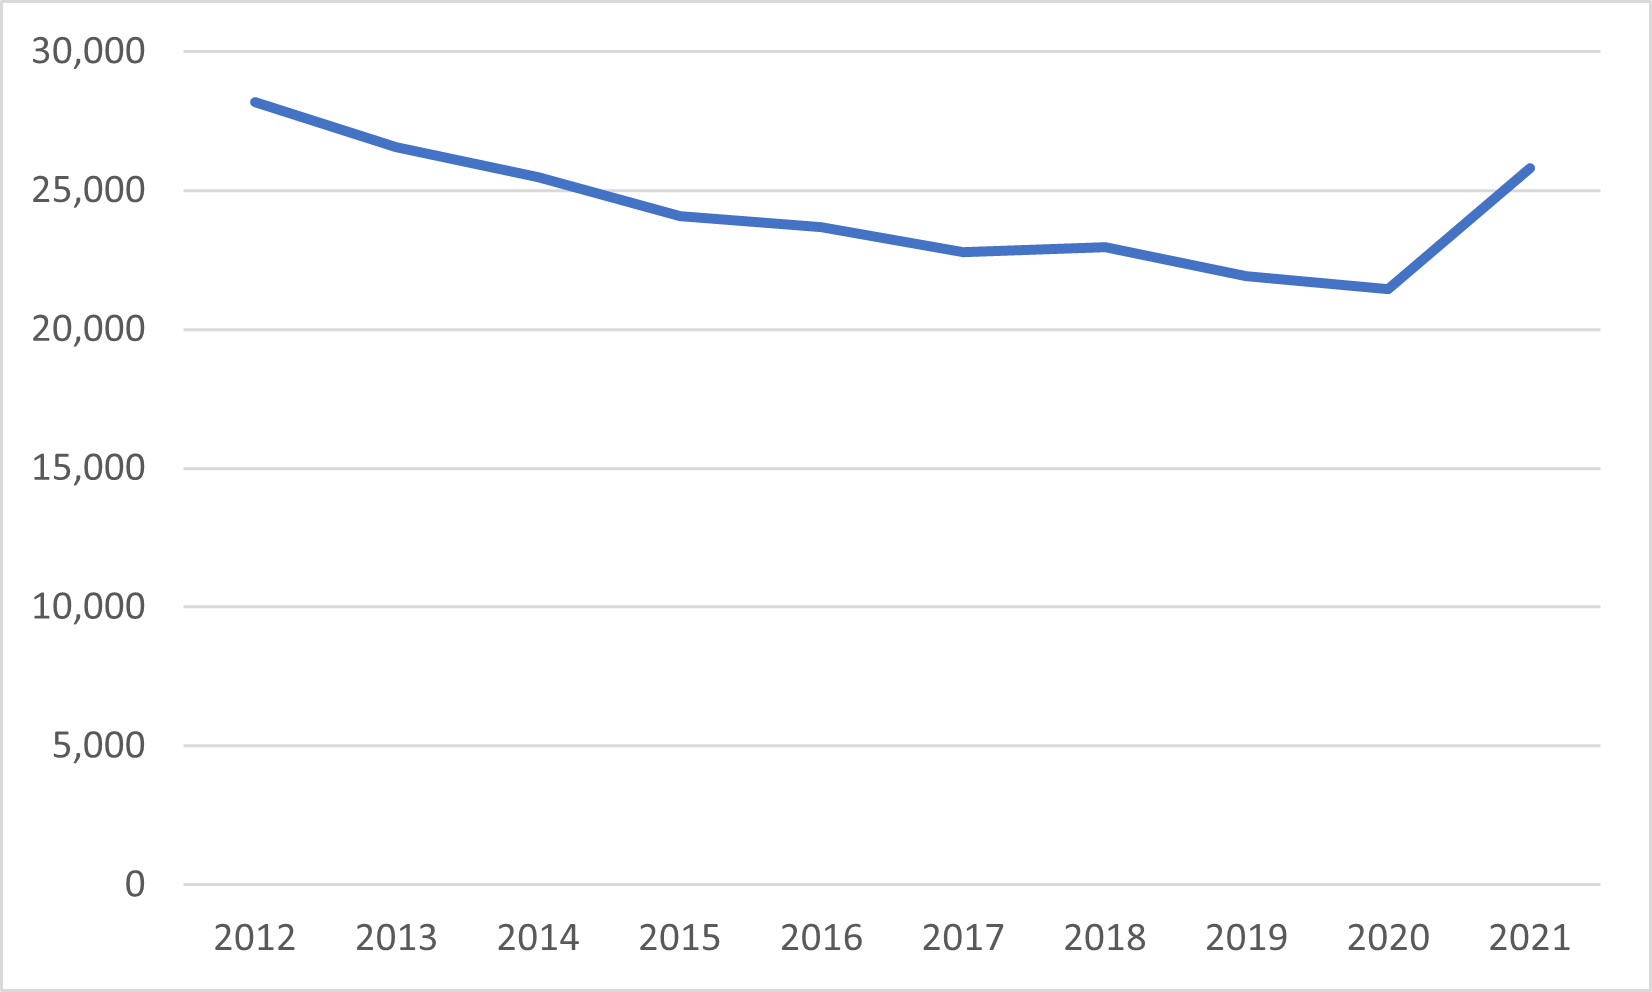
Once you get outside North America, it gets harder to come up with comparable statistics because post-secondary non-tertiary data varies in institutional and programmatic format far more than does degree-level education. Still, let’s consider enrolments in New Zealand’s NZQF certificate levels 5-7, which is more or less equivalent to “post-secondary, non-tertiary education” internationally, which in turn is more or less equivalent to “community college” programs in Canada. To make things comparable, Figure 3 only shows domestic enrolments (New Zealand is the only country other than Canada that has ever seriously tried to market courses at these levels to international students). What you see is a drop of nearly 25% between 2012 and 2020 before a (possibly COVID-related) increase in enrolments in 2021 which nevertheless left domestic enrolment 8% below where it was in 2012.
Figure 3: Domestic Enrolments in certificate Levels 5-7, New Zealand, 2012-21
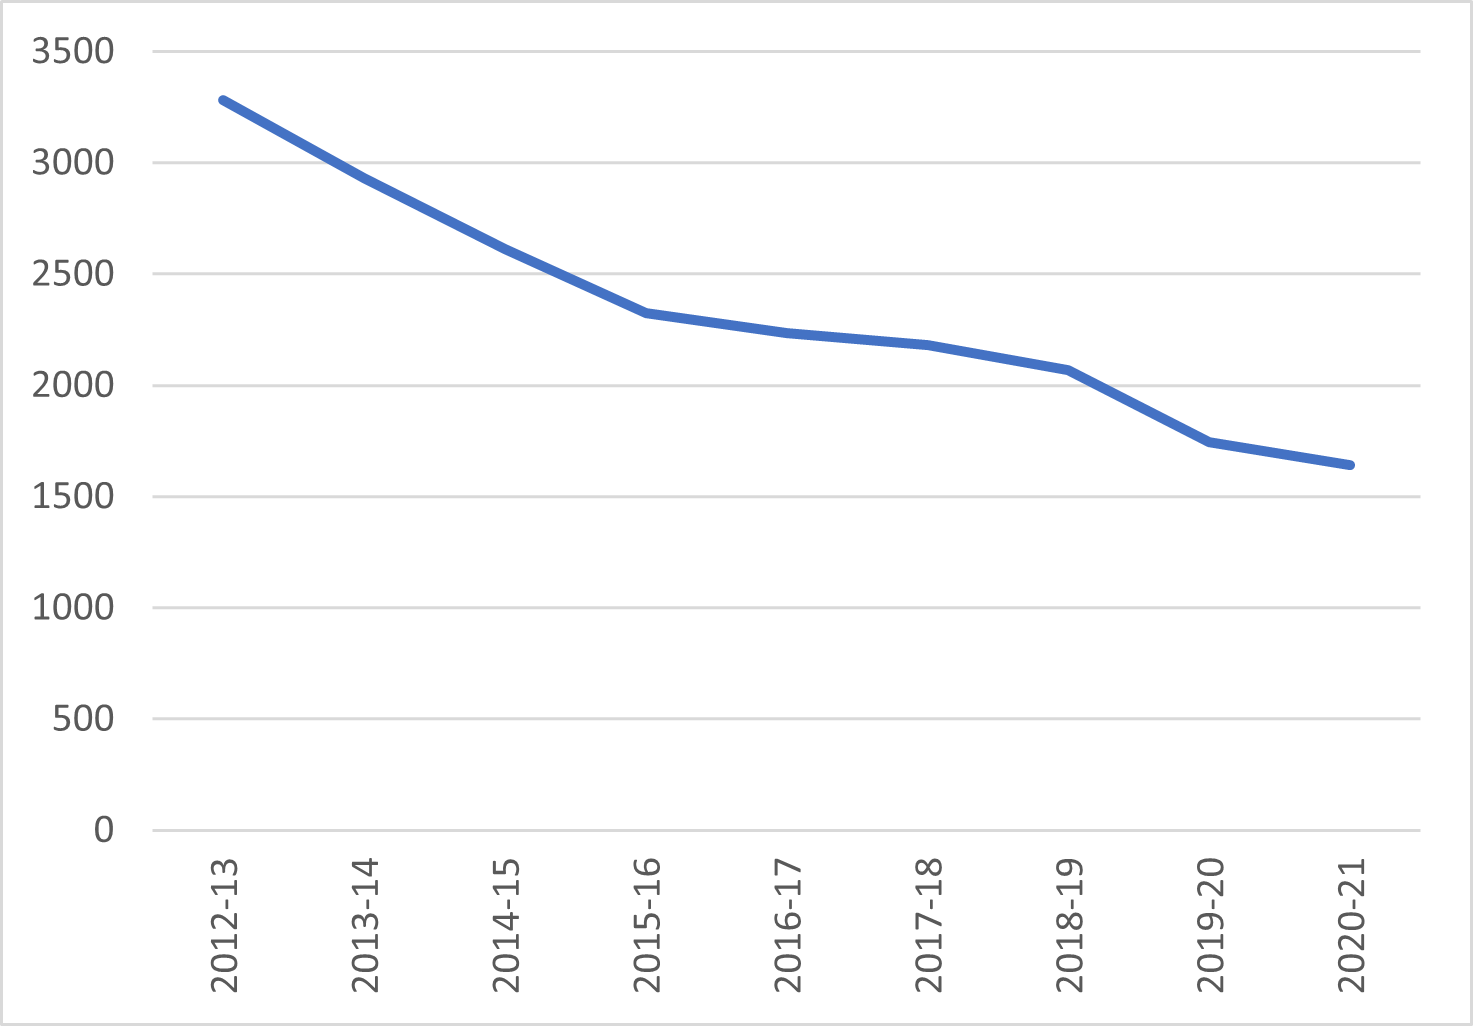
Now over to the UK. Again, it’s not always clear how to count UK numbers in a way that makes for apples-to-apples comparison to North America. What I have used here is enrolments of individuals aged 19+ at Further Education Colleges (FE colleges are a bit like CEGEPs in the sense that they enroll many university-bound under-18s as well, so I am excluding that age group). Here what we see is a drop of nearly 50%, though most of this fall in enrolments is coming at “basic skills” levels (i.e. somewhat below the “college level” here in Canada); the picture is less dire if you look just at higher-level diplomas.
Figure 4: 19+ Enrolments in Further Education Colleges in Thousands, United Kingdom, 2012-13 to 2020-21
I could go on – judging by the chatter I heard at the World Congress of Colleges and Polytechnics this summer, the phenomenon is pretty common across Europe (I’d try to show that but European data at the post-secondary non-tertiary level is notoriously complex and this is one of those times where I must note that this is a free daily blog and you get what you pay for). The only exception to the consistent downward trend is Australia, where Technical and Further Education (TAFE) courses went through a massive boom in the mid-10s when they were suddenly included in the country’s famed Higher Education Contribution Scheme (HECS). However, numbers there crashed once the government changed course after realizing how much money it would lose by continuing down that path (long story short: HECS makes plenty of sense for students who will eventually make above-average earnings, but TAFE students by and large don’t fall into this category).
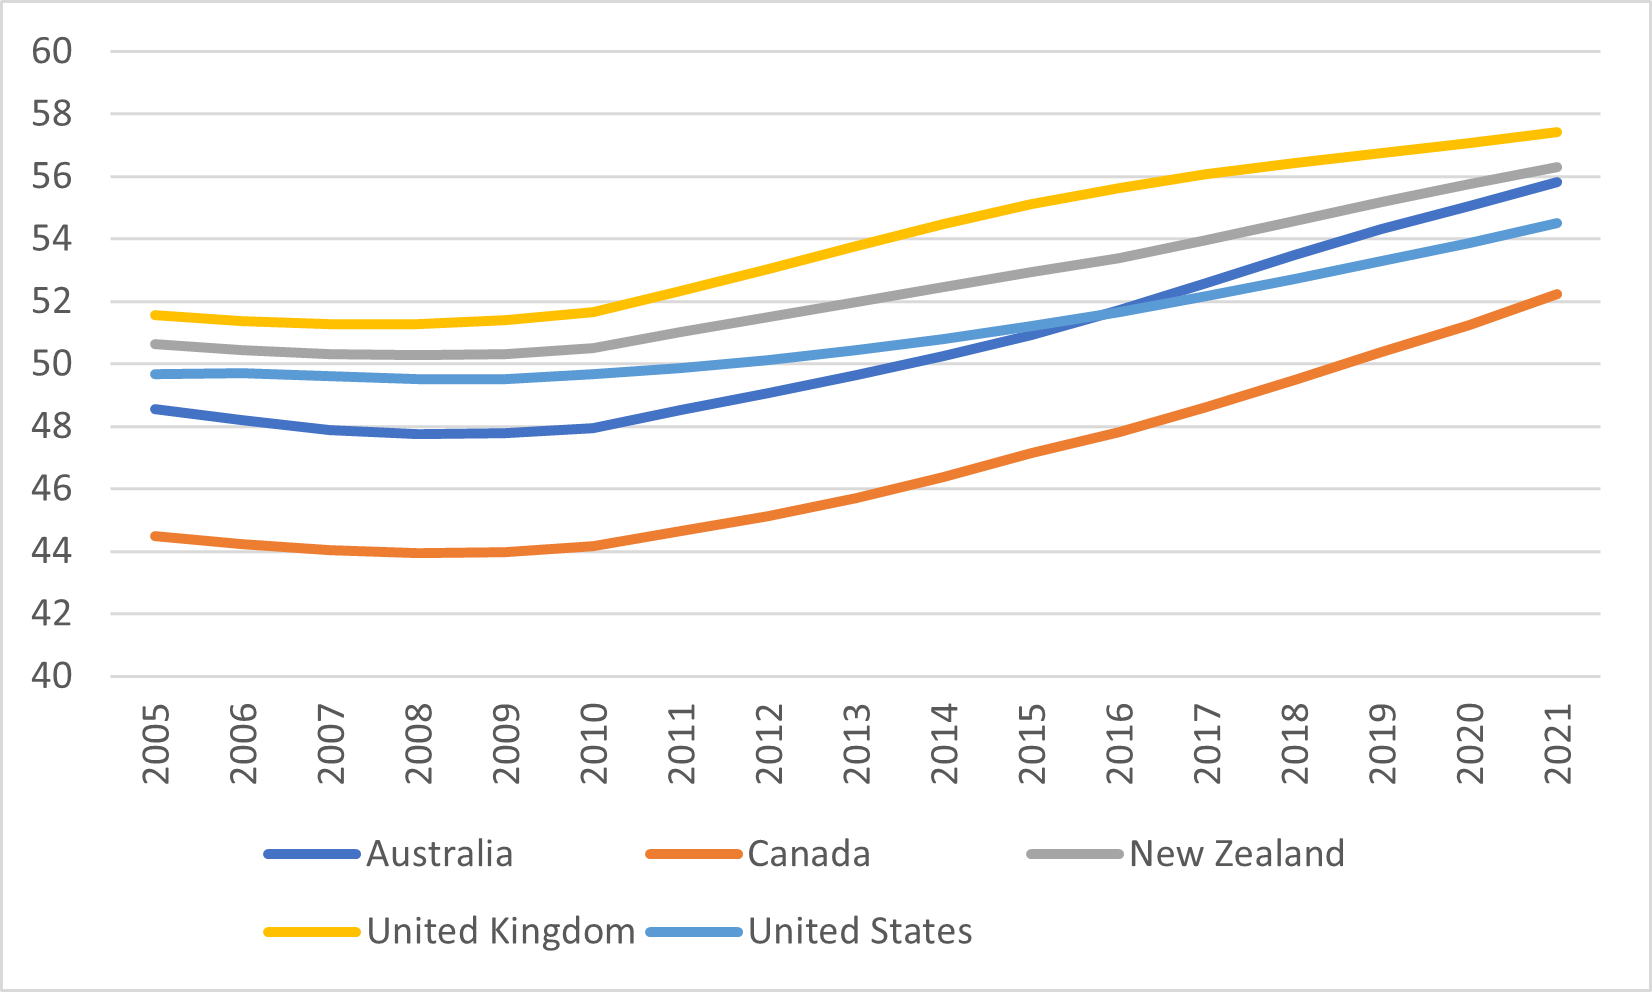
So why is this happening across the world? My guess: demographic changes leading to extremely low unemployment rates. Check out figure 5, which shows the Dependency Ratio in all the major anglophone countries. The Dependency Ratio explains a lot about the state labour markets: it is the combined number of 0-14 year-olds plus 65+ year-olds divided by the number of 15-64 year-olds. At a very rough approximation, it measures the ratio of people who cannot work to those who can. A rising number means that there are fewer workers for every citizen. On the one hand, this means taxes must rise in order to support the non-working population; on the other hand, it also means wages will also tend to rise.
Figure 5: Dependency Ratios, Major Anglophone Countries, 2005-2021
Put it this way: it’s getting easier to hold and keep a job, and that reduces the value of more vocationally oriented training both because students find it more expensive to be out of the labour market, and because the net benefit of the education isn’t what it used to be. To a large extent, our post-secondary non-tertiary sectors were built in the age where capital was scarce and labour was abundant. In such a world, a focus on things like “employability skills” was a big deal because it helped people avoid unemployment. But when unemployment is consistently under 5%, as it has been in the US for a few years now, the appeal of this kind of education just isn’t what it used to be. Whether blue-collar or white-collar, not only is the need to offer high-value training geared towards specific professions is increasingly important, but the need to do so in quickly to minimize foregone income is important as well.
I think Canadian colleges are doing reasonably well on the first score – hence the less-rapid rate of decline of student numbers – but I am not sure they are on the second. I suspect there will be a great deal of pressure in the coming years to find ways to shorten diploma programs, perhaps replacing part of them with optional add-on micro-credentials, because it’s getting too expensive to keep people out of the labour force too long (the same is also true of universities, but I suspect the pressures will be somewhat attenuated here for reasons of prestige as much as anything else).
More on what all that means for institutional management tomorrow.


8 Responses
I don’t think the account of Australia is right. One needs to distinguish between Technical and Further Education which are public colleges, and other providers of vocational education and training, which are mostly small private for profit, like North American private career colleges.
72% of students and 56% of full year training equivalents were enrolled in private for profits in 2019, some 19% of students and 30% of full year training equivalents were enrolled in public Tafes, and the balance in community education providers, dual sector universities, secondary schools, and companies.
Australian vocational education and training enrolments exploded because income contingent loans were extensively rorted by private for profit providers (Auditor General, 2017). It was substantially redesigned in 2016 (Australian Government, 2016) and income contingent loans have been offered for vocational education as VET Student Loans since 2017 (Warburton, 2016).
Auditor General (2017) Administration of the VET FEE-HELP Scheme,
https://www.anao.gov.au/work/performance-audit/administration-vet-fee-help-scheme
Australian Government (2016) Redesigning VET FEE-HELP: discussion paper,
https://docs.education.gov.au/documents/2017-vet-fee-help-scheme-redesign-discussion-paper
Warburton, Mark (2016) The VET FEE-HELP debacle: helping its victims and lessons for administration,
https://www.voced.edu.au/content/ngv%3A74705
And don’t forget that people are figuring out that college is pretty much a rip off at the current prices.
I absolutely loved this blog. As life expectancies grow in anglophone countries and economic demands are ever greater, I wonder whether the dependency ration could be adjusted and how that might affect the trend. Is 14 the correct lower limit? I don’t know that that is reflective as the current entry age to employment anymore. Nor do I think that 65 is the upper limit. I get it, full CPP is attained at 65, but should it? This adds a new dimension. If Canadian government was to restrict full pension benefits to age 70 for example. How would (0-16) + (70+)/(17-69) look?
Seems like the writing is on the wall, folks. And it’s in a universal language.
Great info. Important for post-secondary to take this into consideration. These declines have also been foreseen by many for decades. Look no further than declining birth rates.
Your Figure 1 and Figure 2, are not very comparable. The y-axis in Figure 1 does not start at 0 (starts at 380k). Almost every other graph starts at 0.
The trend line looks the same between 1 and 2, yet the text clearly outlines there’s a difference.
Would have been more useful if it was done by percent of college/university age to determine whether it is declining birth rate or if the price/usefulness of a degree is the issue.
Hard to do sensibly since colleges tend more towards serving the lifeling learning than a typical 18-21 cohort.
The “collapse” might be a phenomenon of regions where higher ed enrolments were high already. In parts of the world where enrolments have been historically low, the appetite for higher ed is still strong. According to World Bank stats, the tertiary enrolment rate (TER) for Low Income Countries is around 11 percent, while for Lower Middle Income Countries it is around 25 percent. There are countries where it is below 5 percent, and higher ed institutions are under a lot of pressure to expand and increase enrolments. The collapse isn’t as much “global” as it is “Northern.”