


Last week, I was in Shanghai at the biennial World-Class Universities Conference, held by the Academic Ranking of World Universities/Shanghai Rankings Consultancy, for which I have the honour to sit on the advisory board. I was presenting some work-in-progress that we have going at HESA Towers concerning the finances of the world’s top universities, and thought I could share some of our findings with you over the next couple of days.
(I know, I know, y’all want to know what I think of last night’s election result. But this blog was written four days ago on an Air Canada flight somewhere over the Pacific, so in truth I have no idea. Check my Twitter TL at @alexusherHESA if you’re really interested.)
So, here’s the story with this project. You may recall two years ago I wrote a series of blogs about the finances of World Class-Universities, a work which HESA Towers stalwart Marcos Ramos and I later turned into this report for the Centre for Global Higher Education in the UK. The upshot of the research was that among top-200 institutions, the amount of extra resources (which we operationalized as “total expenditures per student”) received over the period 2006-2015 was basically uncorrelated to either increased paper production or increased citation of papers.
Not surprisingly, this result made some people – mainly those in the business of arguing for more money for elite universities – quite cross. You aren’t using the right measure of income, they said, use research income/expenditure instead of total income/expenditure. Or you aren’t normalizing properly, you should look at income/research income per faculty member, not by student. So, this time out we tried to collect data on all of those things, again back all the way to 2006.
Research output – whether in terms of publications or field-normalized impact – can be measured in a relatively standard way through bibliometrics, and we use the Leiden CWTS data to look at this. All the other stuff, though, is trickier. Within a country, institutions tend to report things like income, research income, students and faculty in a relatively consistent way, but cross-nationally absolutely nothing is consistent. What is included in an institutional budget is different mainly due to the different nature of universities in different parts of the world, student counts are different (FT? FTE? Headcount?), research income is all over the place because of the way government-to-institutions flows are structured, and faculty…I can’t even count the ways faculty numbers differ. But as long as each institution has a relatively consistent time series, we can look at the change over time, and thus examine the effect of changes on the outcomes we care about.
Anyways, today I will talk about the raw funding data, tomorrow I will talk about the student and faculty numbers, and on Thursday I will talk about the relationship between all these variables and research output. All good? Sitting comfortably? Then I’ll begin.
In the following graphs I look only at data from the top-200 institutions located in the US, the UK, Australia, Sweden, Switzerland, the Netherlands, Germany, Japan and Canada. China is not included because financial data only goes back to 2012; South Korea, Russia, Saudi Arabia and France are all excluded because their universities do not publish financial data, other countries are excluded from this exercise because they have fewer than five institutions in the top-200. This leaves us with a pool of 147 institutions. US public and private institutions are reported separately. With all that in mind, take a gander at figure 1, which shows the average increase in real (i.e. inflation-adjusted) funding, by country.
Figure 1: Percentage Increase in Total Institutional Expenditures Among ARWU top-200 institutions, by country, 2005-6 to 2016-7
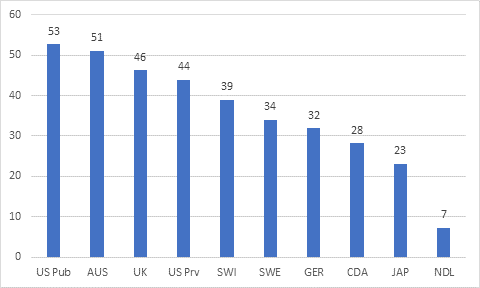
It’s not exactly a surprise that different countries seem to have different outcomes. But the spread here is pretty amazing and it’s notable that those institutions in countries with the longest history of having “entrepreneurial universities” – that is, the US, the UK, and Australia – have had the largest jumps in institutional funding. (I am using expenditures rather than income as the measure because it tends to be a little less volatile, but over the long run expenditure and income tend to converge, so forgive the imprecise language.) This can overstate the importance of entrepreneurship in the private sector: for the most part the big increases in the US public system seem to come from institutions heavily implicated in the health care sector (e.g. UC San Francisco, UT’s MD Anderson Cancer Center). Canada’s performance has picked up considerably in the last couple of years, mainly due to the infusion of money from international students; the Netherlands’ performance is really sad.
Figure 2 looks at research funding, where it is a *completely* different story. Now, remember, these bars aren’t quite comparable, because different countries calculate research funding differently. But based on their own definitions, theseare the percentage increases in research income over the period 2005-6 to 2016-7.
Figure 2: Percentage Increase in Total Institutional Research Income Among ARWU top-200 institutions, by country, 2005-6 to 2016-7
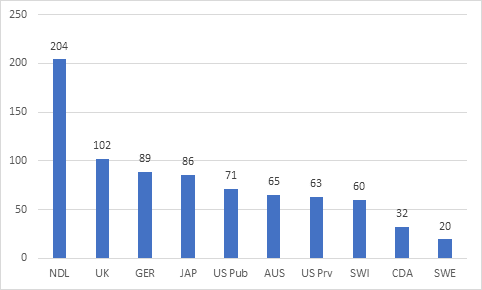
Wild about the Netherlands, right? As near as I can make out, this is because their institutions are incredibly good at organizing consortia to attract funding from the big European research funds (e.g. Horizon 2020) and not because the Dutch government has gone hog-wild on research. Conversely, Australia and the US look a lot more mediocre on this measure than they do on total funding. Canada and Sweden are definitely on the low end here.
All of which is to say: there is a lot of variation on both indicators, but it’s not the same variation. If the origin of the funding matters, we would expect to see very different results from correlations across these two measures and research incomes. We’ll get to that on Thursday. Tomorrow: changes in students and faculty.


One Response
Hear Hesa Towers
I think figure 2 is the same as figure 1.