


It turns out that a lot of you really hate the idea that Canada might be experiencing some success with respect to affordability in universities. Critics seem to focus mostly on one of two factors.
- 15 years is not nearly enough to declare victory, one must look, 25, 30 or even 50 years in the past!
- It’s not just tuition, it’s “the cost of living”.
I will deal with the first criticism today and leave the second to tomorrow.
Let’s start with the time frame issue. The problem is the availability of data. Statistics Canada’s current data on student “tuition and fees” only goes back to 2006-07, but with only a tiny series break, can used back to 1993. Prior to 1993 no data was collected on additional fees, only tuition, and that only back to 1971. With respect to wages, the Labour Force Survey apparently only started collecting this data in 1997, but if you combine data from the (smaller) series of surveys that have looked at other type of labour force issues over the year (the Survey of Consumer Finances (SCF), the Survey of Labour and Income Dynamics (SLID) and the Canadian Income Survey (CIS)), it is possible to get some kind of track back to as early as 1976. As for student aid figures – well, there is not official data base and it’s just stuff I’ve been collecting for the last couple of decades on my own – but the record ends between 1990 and 1992, depending on the province. So those are the varying temporal limits on comparisons.
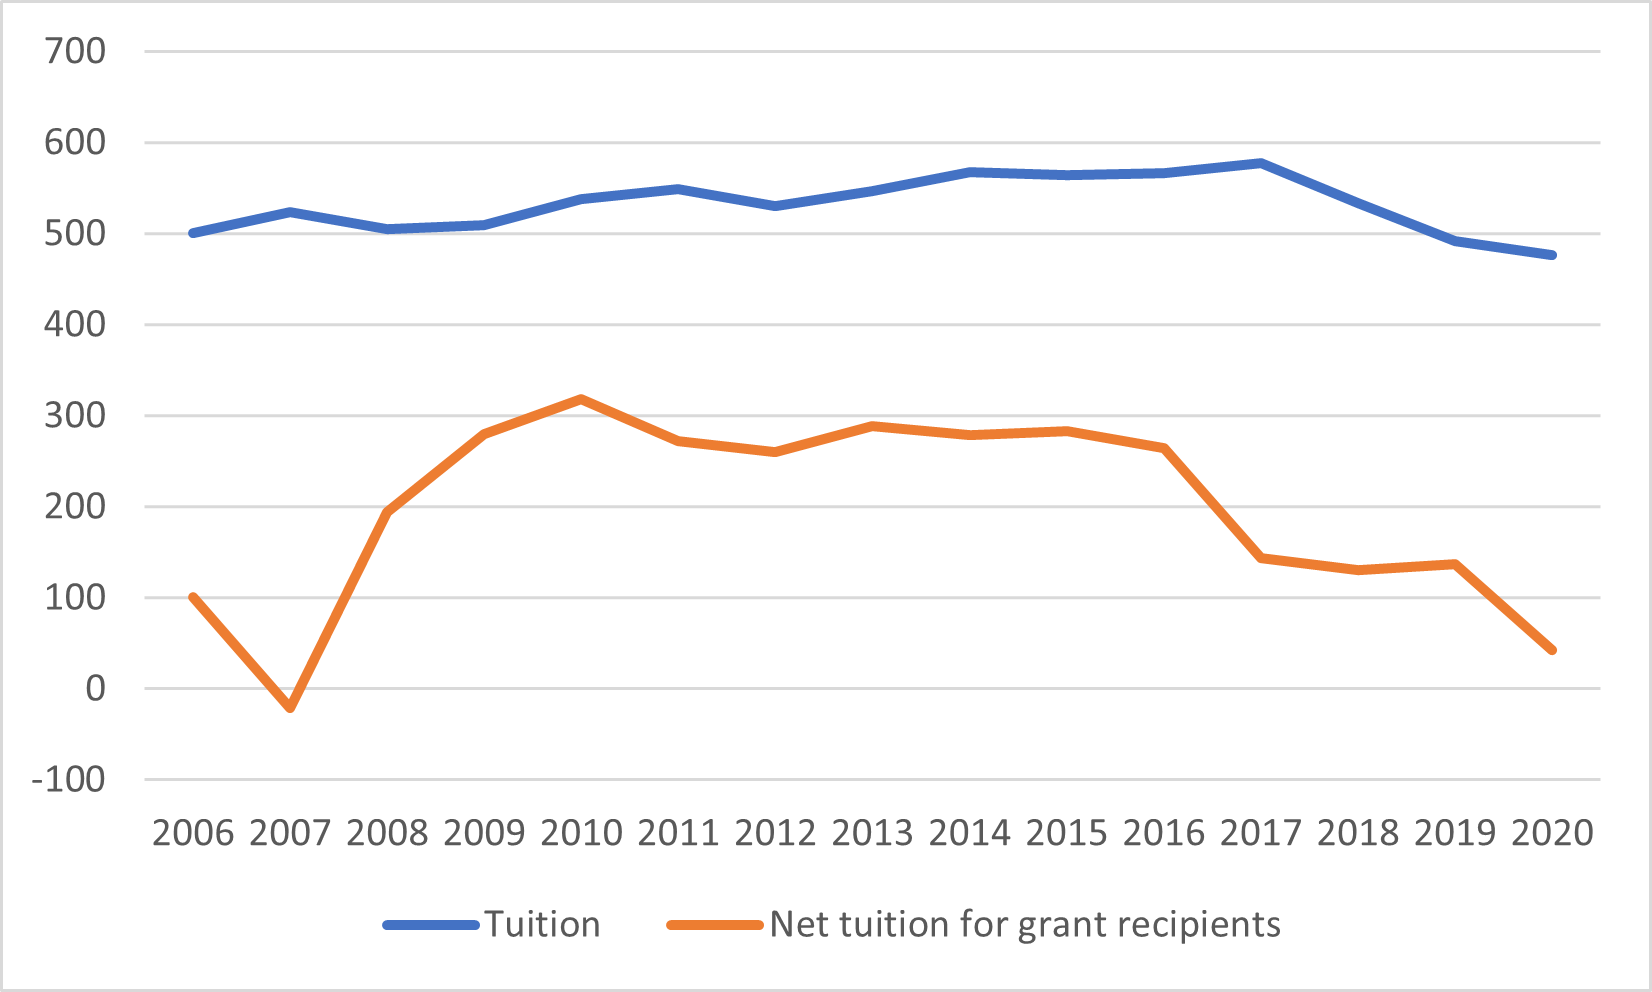
Given all of that, let me now take you backwards from where I left off last week in 2006, which was with Figure 1, showing tuition (that is, average sticker price) and net tuition (that is, sticker price minus average grants for those who receive them) in terms of hours of required at median wages for 15-24 year olds. The conclusion is that in a fifteen-year perspective, it would be hard to claim anything that 2020 was one of the best years on record for affordability, at least since 2006.
Figure 1: Hours Required to pay Average Tuition Fees and “Net Tuition Fees for Grant Recipients” at Median Wage for 15-24 year-olds, Canada, 2006-2020
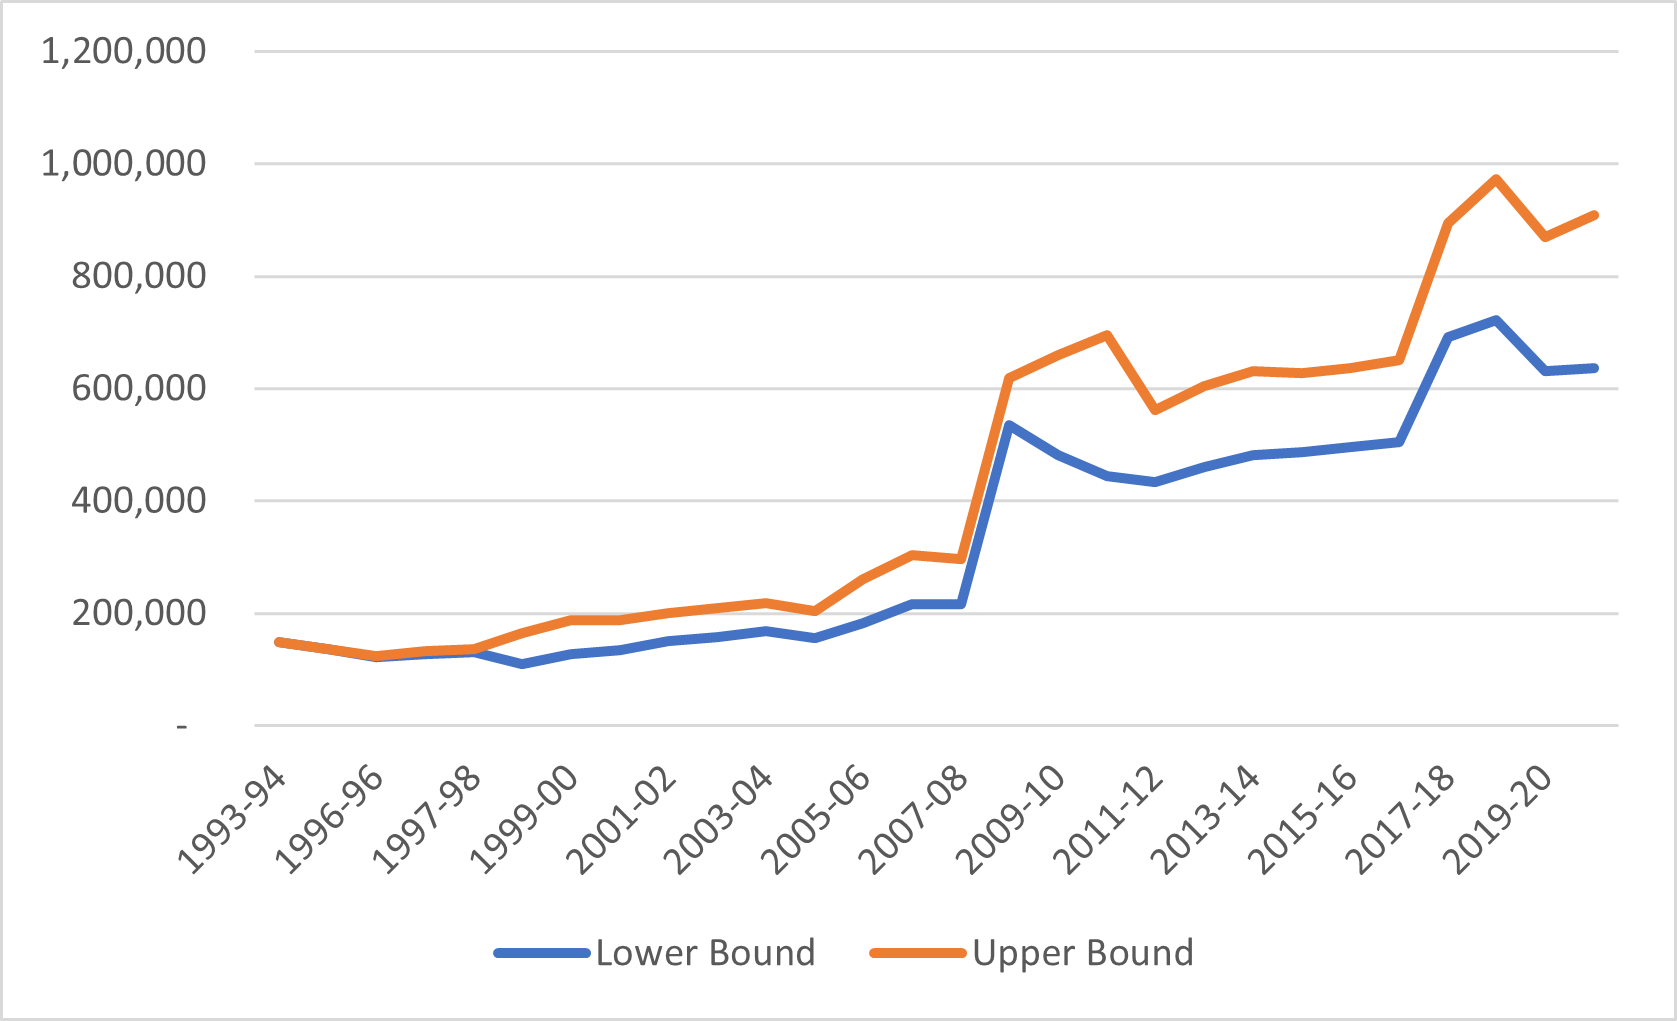
I should confess that I made a small mistake last time, under-reporting the number of grant recipients (but not the amount of grants) pre-2011. This means that while the number of students receiving grants was less impressive than I suggested (I estimated 4x since 2006, when it was likely closer to 3x), it also means that the average grants per student in the pre-2011 period was smaller than I implied and hence net tuition for grant recipients higher in the pre-2011 period too. Mea culpa. Figure 2 shows the corrected upper- and lower-bound estimates for the number of grant recipients since 1993 (note that there was no meaningful difference between the two until the then-Canada Student Loans Program began seriously getting into grants around 1997). The grant recipient number used in calculating average grant numbers is the mid-point between these two figures.
Figure 2: Lower-and-Upper Bound Estimates for the Number of Student Grant Recipients in Canada, 1993-94 to 2020-21
Applying these numbers to tuition plus ancillary fees (which go back to 1993), and median youth wages (which exist back to 1997 and can be adjusted backwards a bit using the SCF/SLID/CIS data), and you get a picture that looks like figure 3.
Figure 3: Hours Required to pay Average Tuition Fees and “Net Tuition Fees for Grant Recipients” at Median Wage for 15-24 year-olds, Canada, 1993-2020
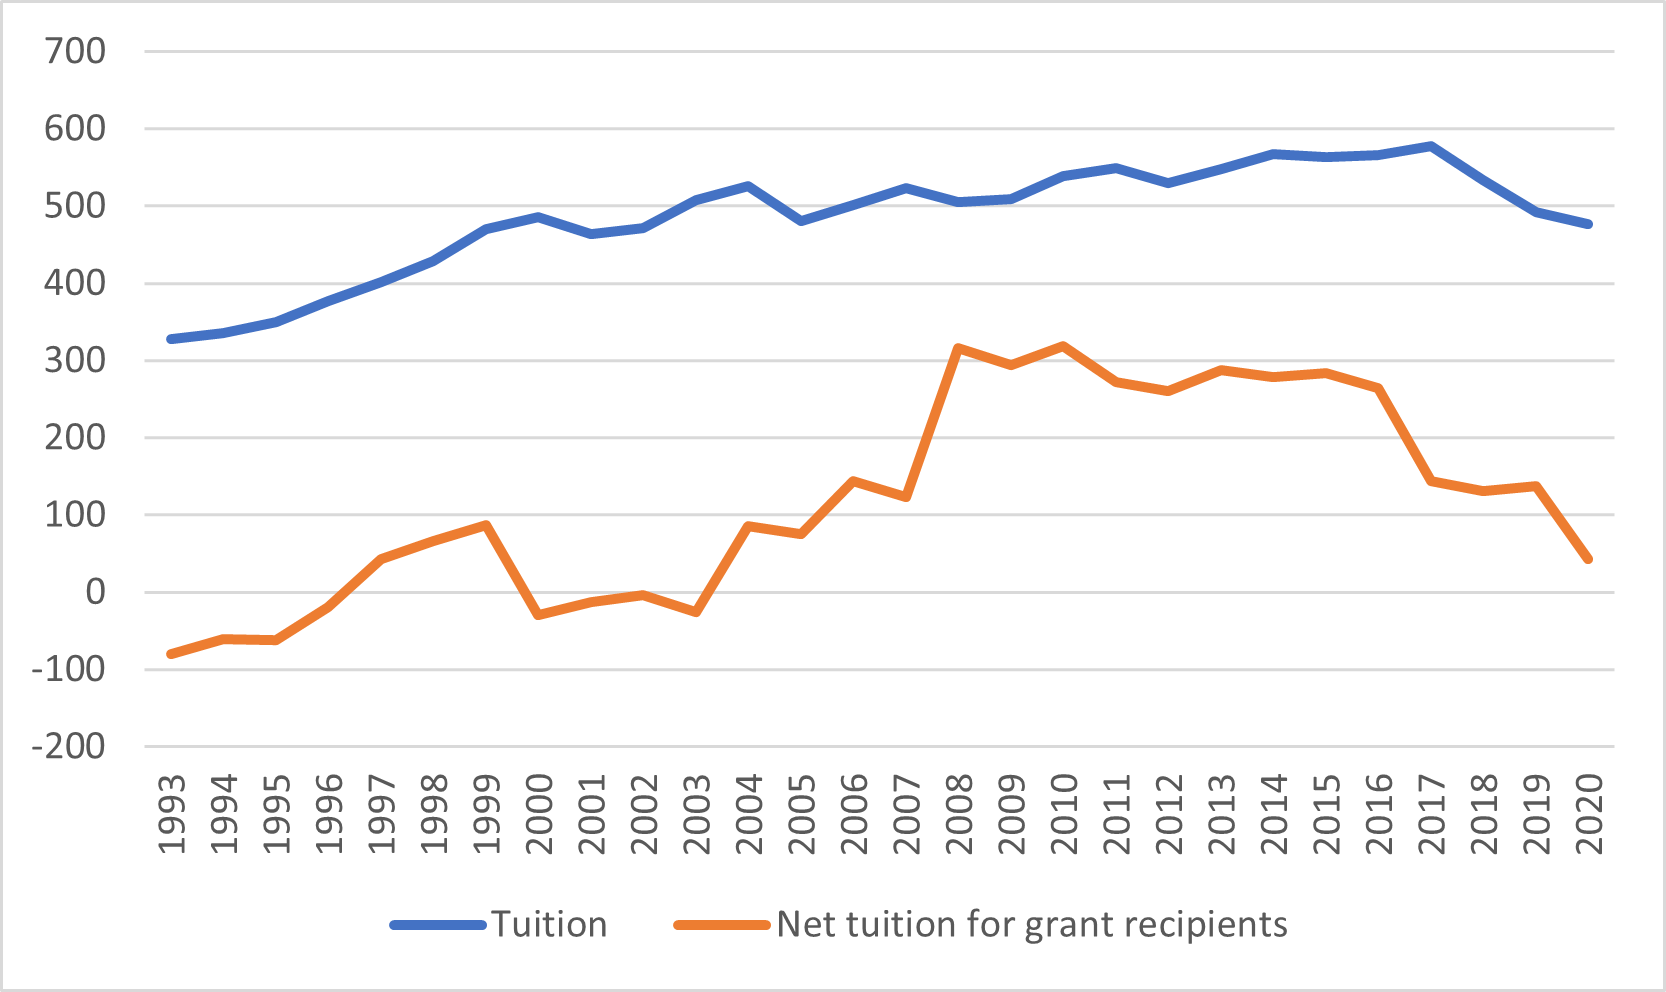
Now the best way to read figure 3 is in conjunction with figure 2. For those students who in both periods would have received grants (that is, maybe 10-15% of the student body), the 1990s were better than 2020. Similarly, for those who in neither period would have received a grant (approximately 35%), the 1990s were better than 2020. But the other 50% of the student body – those who received a grant in 2020 but would have stood no chance of receiving one in the 1990s, the ones who switched from being in the blue line to being in the orange line – they are definitely better off.
Ok, so that’s the 25-year picture. What about longer term? Well, for figure 4, I took SCF/SLID/CIS data on median annual income – no hourly stuff before the 1990s – and divided it by tuition only (some people seem to be of the opinion that fees are a newly-huge freaking thing, but I checked StatsCan and from 1993 to 2000, national ancillary fees were never more than 13% of total combined tuition and fees and never less than 11% and I bet if we pulled things back to the 70s we’d find something awfully similar). And here’s what it looks like.
Figure 4: Percentage of Median Annual Income for 15-24 year-olds Required to Pay Tuition, Canada, 1976-2020
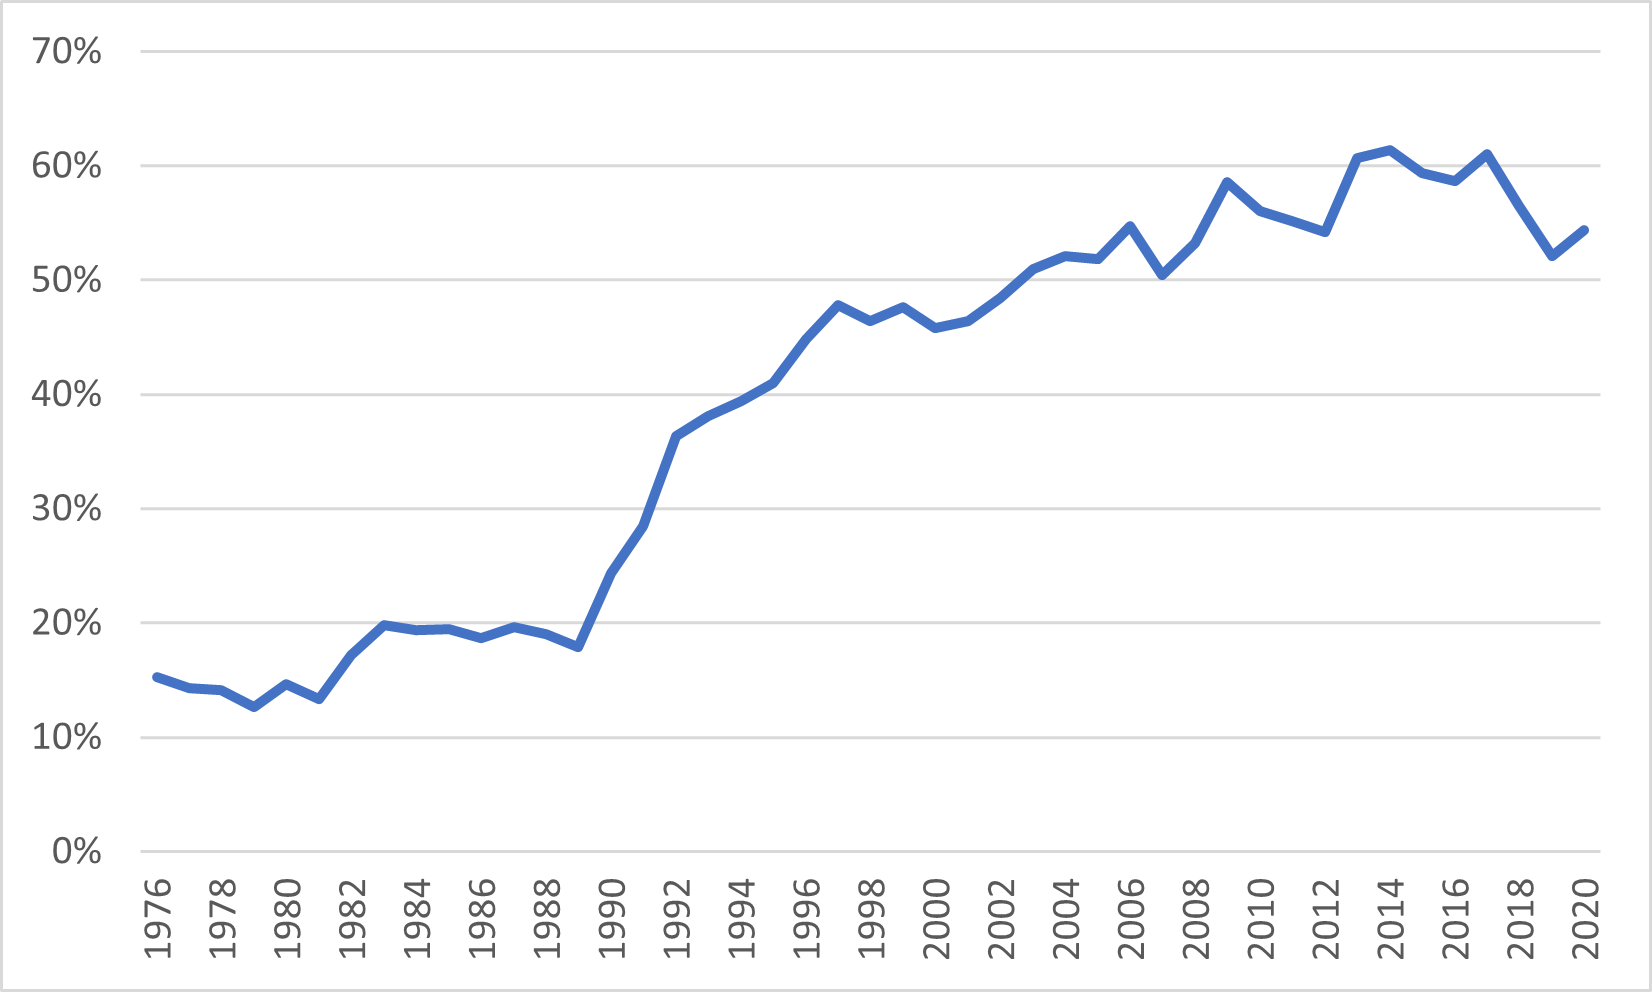
Aha, you say! Look, massive rises in relative cost/declines in affordability in the 1990s! That’s what we should be aiming for! Well, hold on. I need y’all to consider a few things first.
First, remember that enrolments today are about quadruple what they were in the mid-1970s. So whatever one wants to say about the effects of “lessened affordability”, lessened access is not one of them.
Second, keep in mind that figure 1 is a ratio. And there are two pieces in that ratio: tuition, and income. And guess what? The change in ratios was due to movements in both.
Figure 5: Median Annual Income for 15-24 year-olds and Average Tuition Fees, Canada, 1976-2020
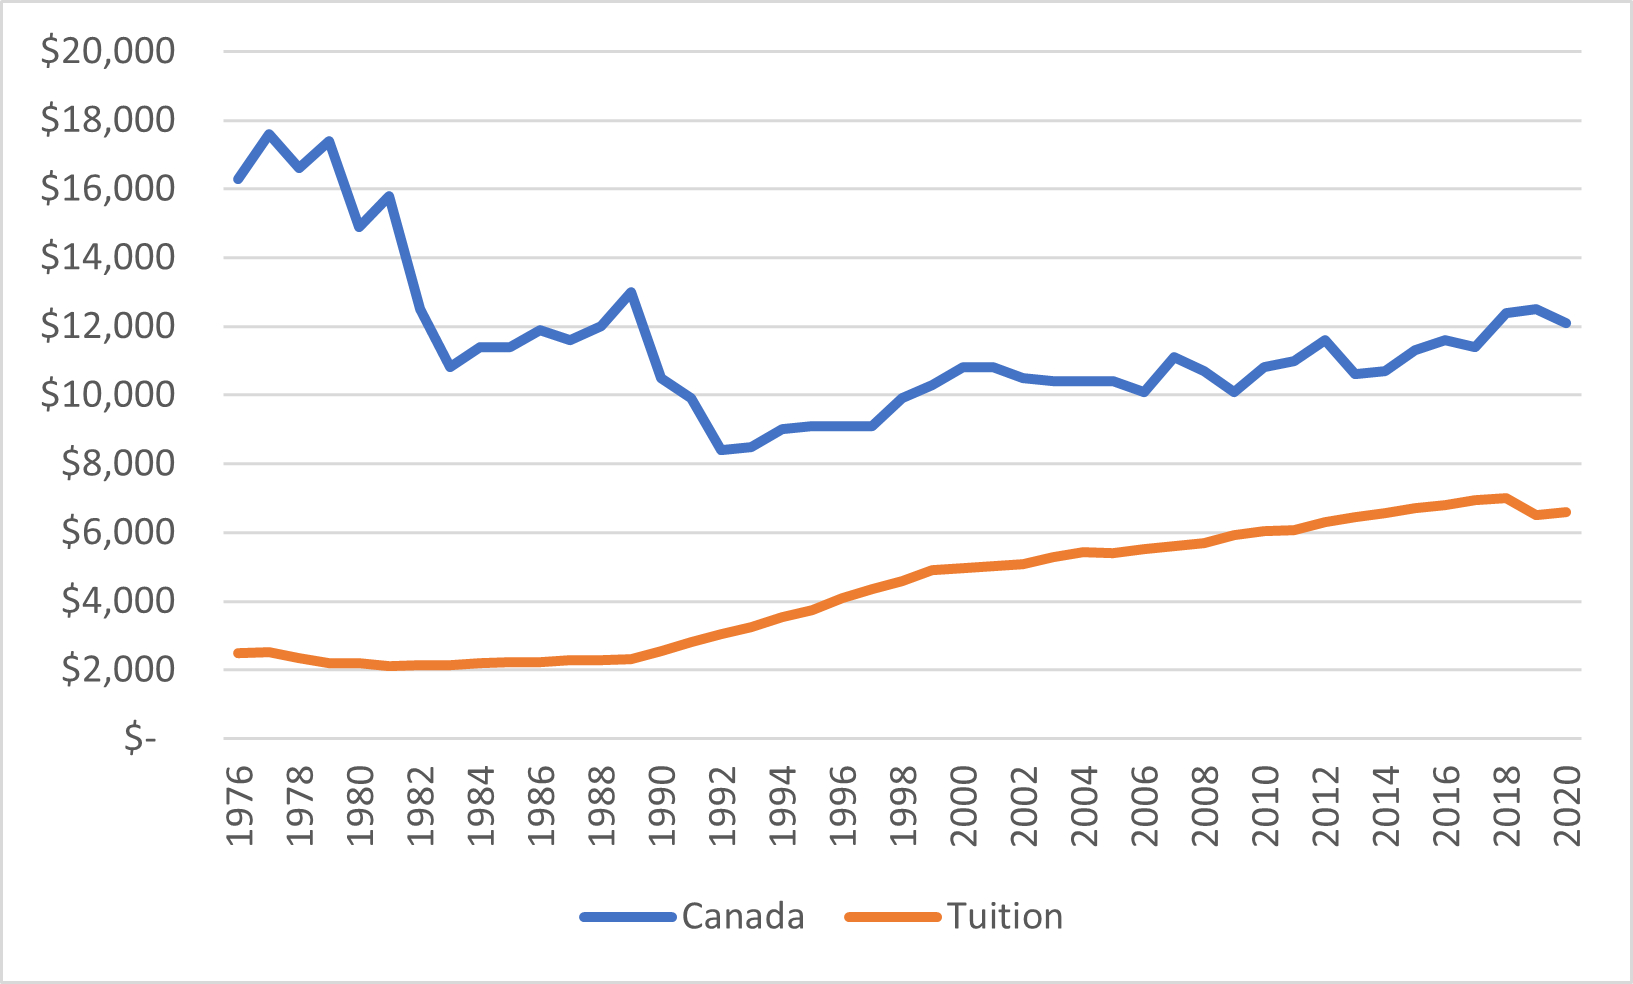
Was there a big jump in tuition in the 1990s which prompted a decline in affordability? Indeed there was. But what caused that jump? Government austerity was the proximate cause, but the larger reason was simply that the thriving Canadian economy of the 1970s couldn’t and didn’t survive the much harsher environment of the 1980s. Between 1979 – the year of the second oil crisis – and 1992, the median income of 16-24 year-olds in Canada fell by half in real dollars. Previously, we could afford to lavishly subsidise higher education for the few precisely because it was relatively easy for the many to earn a living and contribute to the tax base without it. As the days of easy jobs in manufacturing and resource extraction (primarily for men) came to an end, suddenly taxpayers found them squeezed at exactly the time that the need for higher education became more acute. Governments tried to hold the line for a decade or so – hence the flat line in the 1980s – but eventually the deficits incurred became too large, leading to the austerity of the 1990s.
In other words, to some extent the change in affordability we experienced in the 1990s is just the natural product of skills-based economic change. What was possible when only a tiny fraction of the population wanted higher education might simply not be so when a large percentage wants it.
But, regardless, what the evidence shows is while the sticker price of education has risen inexorably over the decades, that the expansion of grants in the past few years has made a lot of students better off than they would have been at any time in the past thirty if not forty years. And to the extent that these people have been correctly targeted – that is, they are in fact those in greatest need of money to attend post-secondary education – then this is something to celebrate.

