


Note: this article contains references to sexual violence, harassment, and suicide/self-harm.
For a couple of decades now, the American College Health Association (ACHA) has been administering a ridiculously long and detailed survey called the National College Health Assessment, which goes under the unwieldy title of ACHA-NCHA. Since 2013, a number of Canadian institutions have taken part in this as well, which allows for some reasonably interesting comparisons over time. (N.b. since Fall 2019, a new iteration of the survey has been in the field and some questions are now worded a bit differently, but in many cases, it is reasonably straightforward to cull similar information).
The Canadian ACHA suffers from something of the same problem as the Canadian Undergraduate Survey Consortium (CUSC) if you’re trying to make comparisons over time. In the Spring of 2013, there were 32 schools involved, a number which grew steadily to 41 in Spring 2016, 52 in Spring 2019 before falling back to just 16 in Spring 2022 (the numbers fell because a significant number of Canadian institutions defected away to create the Canadian Campus Wellbeing Survey, which in true Canadian fashion does not make summary reports available to the public, which makes me grind my teeth). The difference is that where CUSC has over time tended to take in a lot of small institutions, the Canadian ACHA-NCHA sample tends to skew towards larger institutions in big cities.
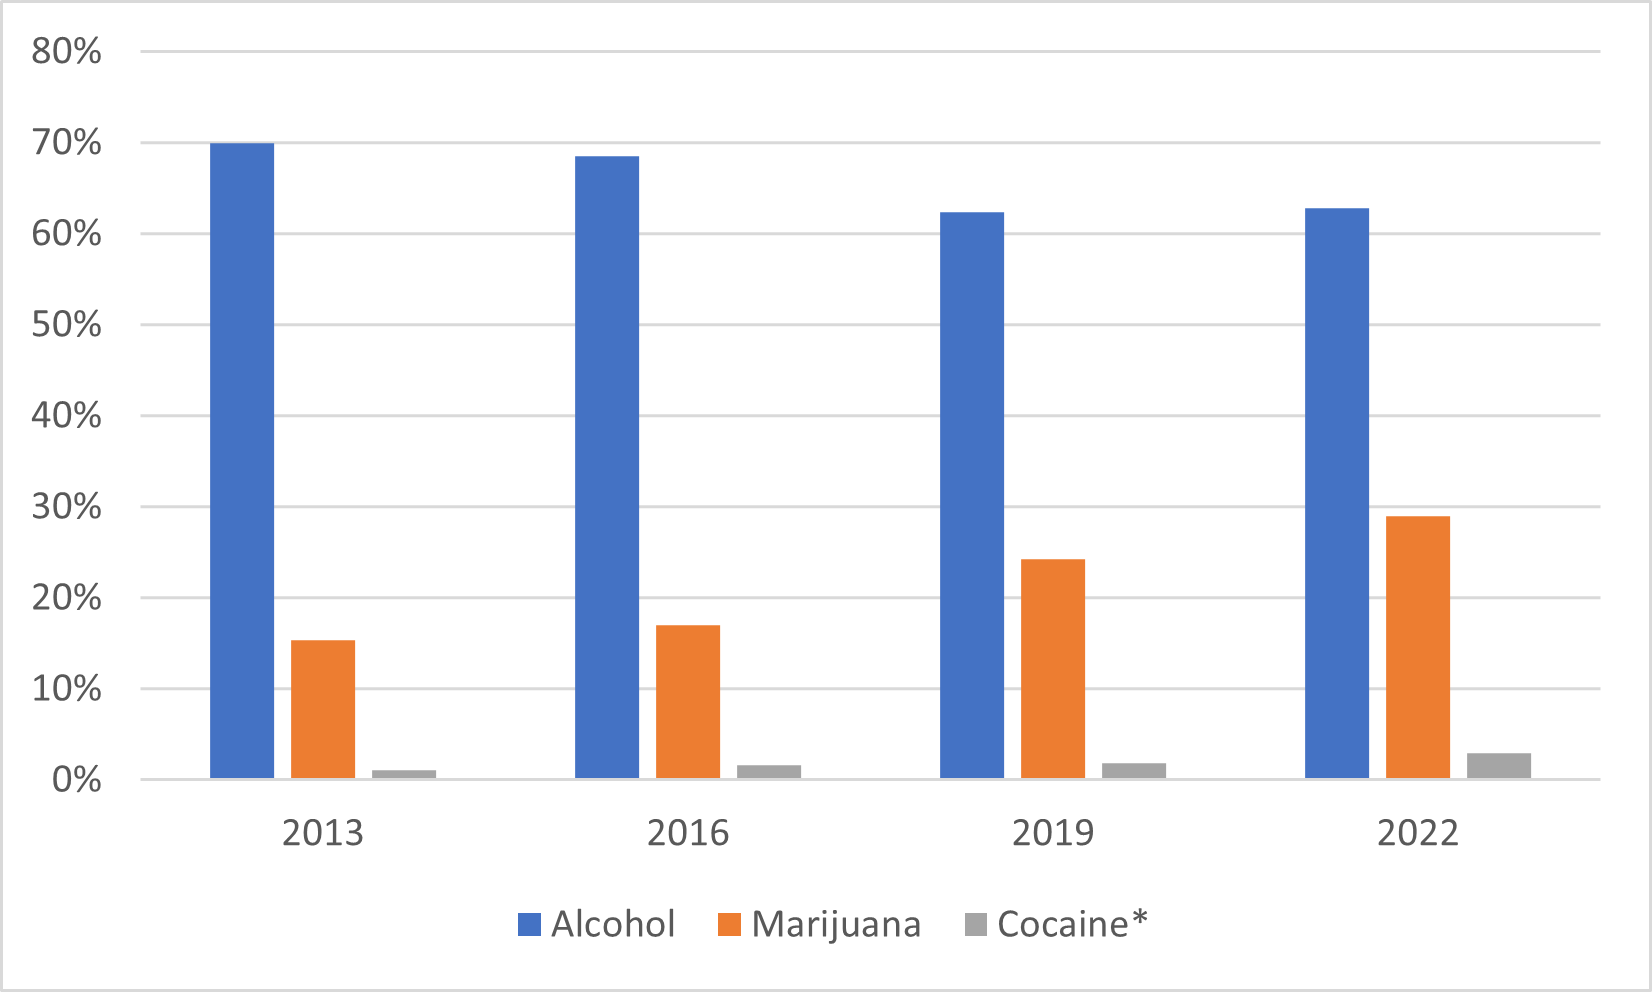
Before I get to the mental health stuff, I just want to show data on a couple of other points to give you a sense of how the data does or does not change over time. First, data on the use of drugs and alcohol. Alcohol use is down somewhat, from 70% saying they used it in the past month in 2013, to 63% in 2022. Marijuana use is up significantly, nearly doubling over nine years: one has to believe this is partially an outcome of legalization. Cocaine use was in the 1-2% range from 2013 to 2019; the figure for 2022 was 3% but because of a change in the question wording, the survey now only measures use of this drug every three months instead of every month, so the results are consistent.
Figure 1: Students’ Monthly Alcohol & Drug Use, Canada, 2013-2022
Then there is the data on various forms of violence experienced in the past 12 months, which is much harder to interpret. Rates of non-consensual sexual touching, non-consensual sexual penetration and stalking (all of which are much more frequently reported by cis women and trans/gender non-conforming students than cis male ones) all seemed to be strongly on the rise between 2013 and 2019 and then suddenly dropped off a cliff in 2022. Was it because of the very different set of institutions involved (which could also explain the rise in previous years)? Or was it COVID and the fact that students were in less frequently in physical proximity than in previous years? It’s hard to tell.
Figure 2: Students’ Experience of Violence/Assault, Canada, 2013-2022
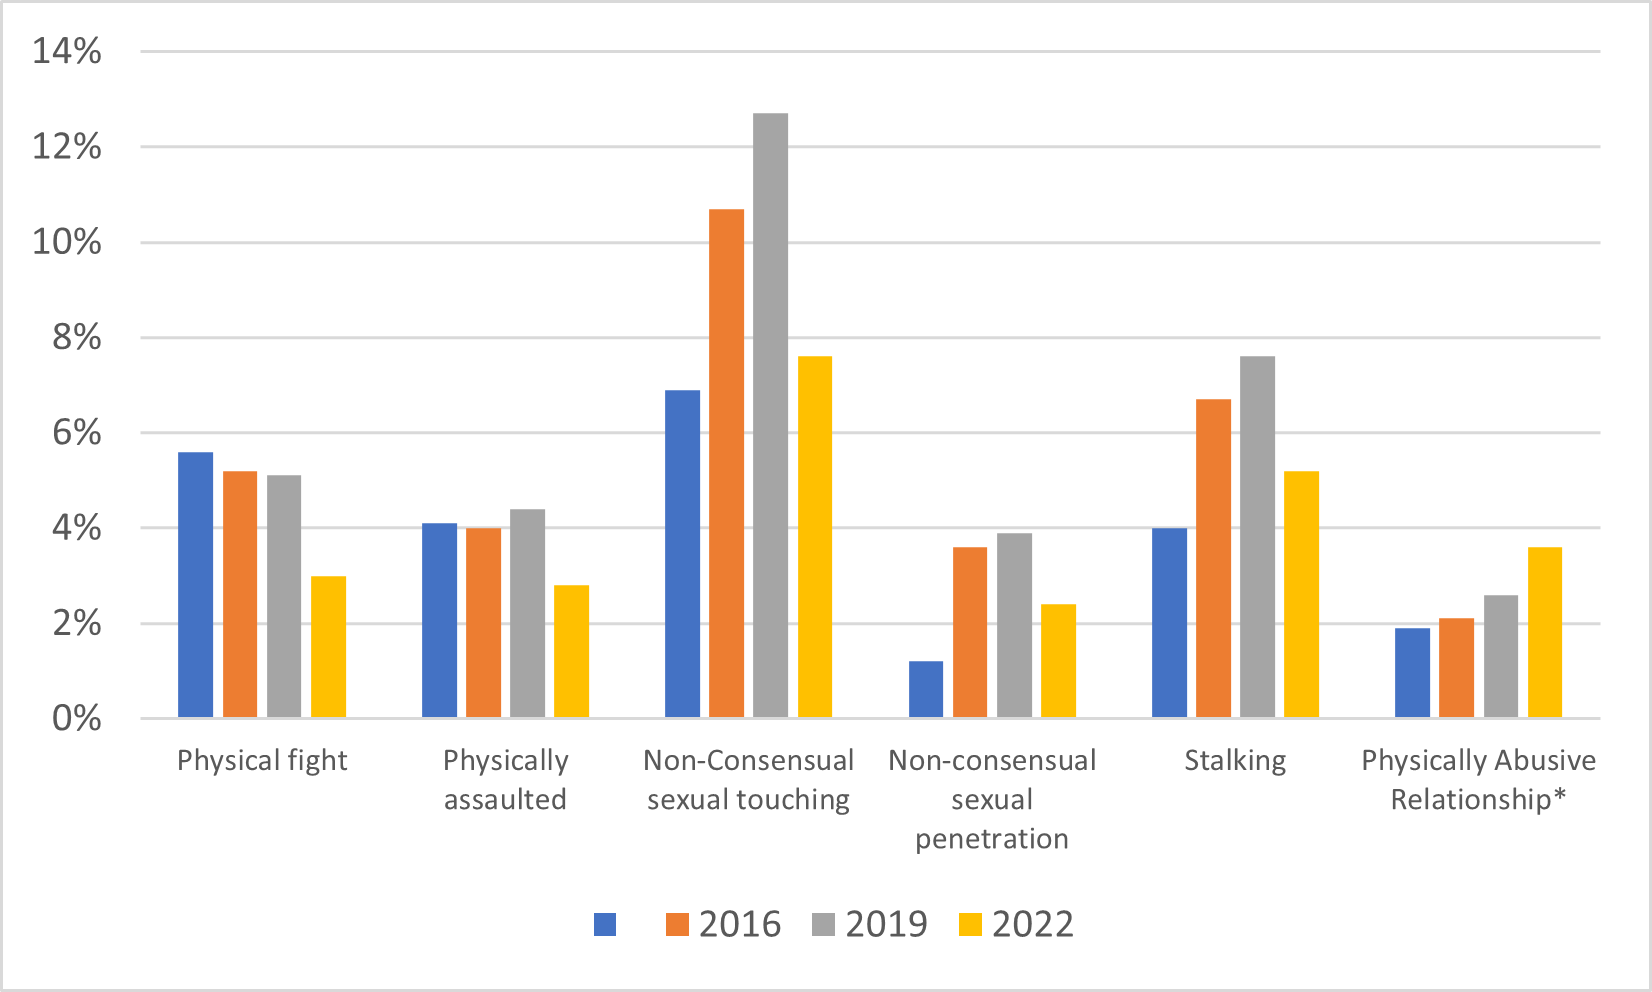
Figure 3 is the one that initially blew me away. The survey asks individuals if they have been “diagnosed with or received treatment for” various conditions over the past 12 months. Here I pull out just a few responses related to learning and mental health, and it’s stunning. Rates of anxiety and depression are both up by 150% in less than a decade. ADHD rates? Up more than fourfold. And remember, these aren’t self-diagnoses – these are the proportions of people being diagnosed or treated.
Figure 3: Reported Levels of ADHD, Depression and Anxiety, Canada 2013-2022

Now, there are a number of ways to interpret this data. One is that today’s students are fundamentally different than previous generations, with higher levels of mental health challenges/learning disabilities. Another is that they are not that different, but society now medicalizes conditions that were not previously medicalized. A third potential factor is greater acceptance of and therefore reporting of mental health challenges and learning disabilities. A final one says the students aren’t that different, but they just are having a hard time of everything (whether this is objectively true or whether it is just the outcome of everyone spending a lot of time on anxiety-inducing social media is a separate question). And of course, potentially each of these explanations plays a part.
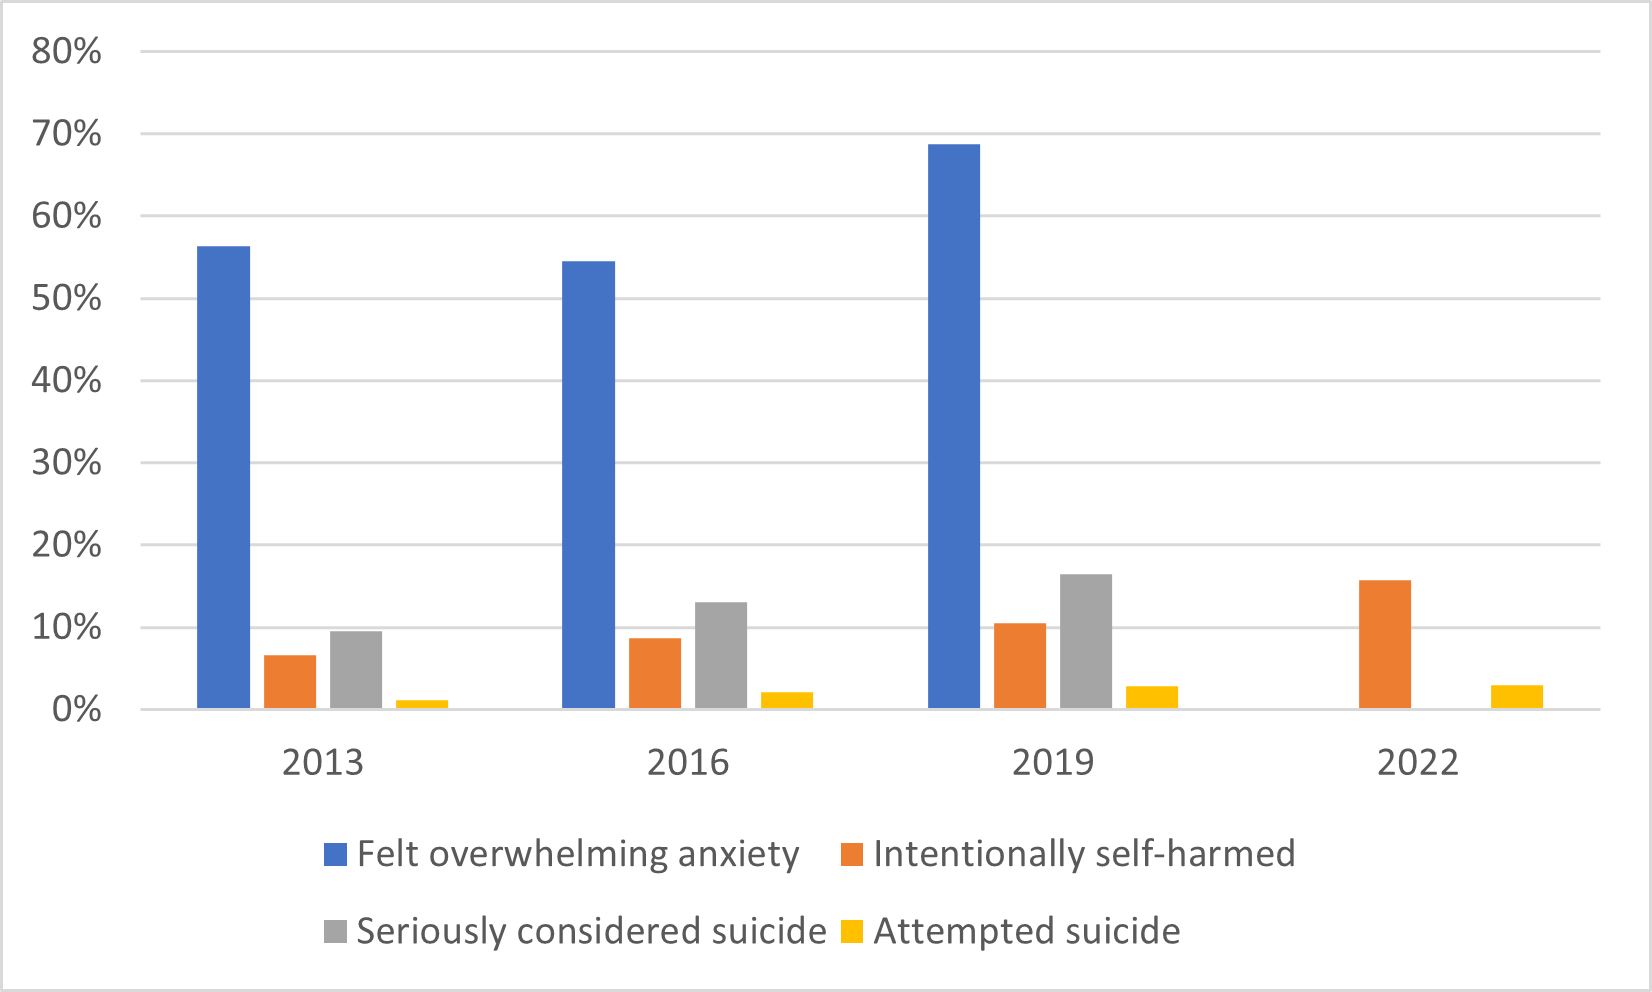
I don’t know exactly how one would separate these issues empirically but let me just throw two more graphs at you. Figure 4 shows the percentage of students reporting various conditions or actions over the past twelve months. For simplicity, I pick out just a few from the survey, two of which unfortunately are asked in a different manner in the 2022 survey and so have had to be eliminated. But for the ones with consistent responses across all four surveys: the percentage of students who say they have intentionally cut, burnt or otherwise injured themselves in the past 12 months rose from 7 to 16% in 9 years; those with attempts at suicide from 1.1% to 2.9%.
Figure 4: Rates of Anxiety and Self-harm in Past Twelve Months, Canada 2013-2022
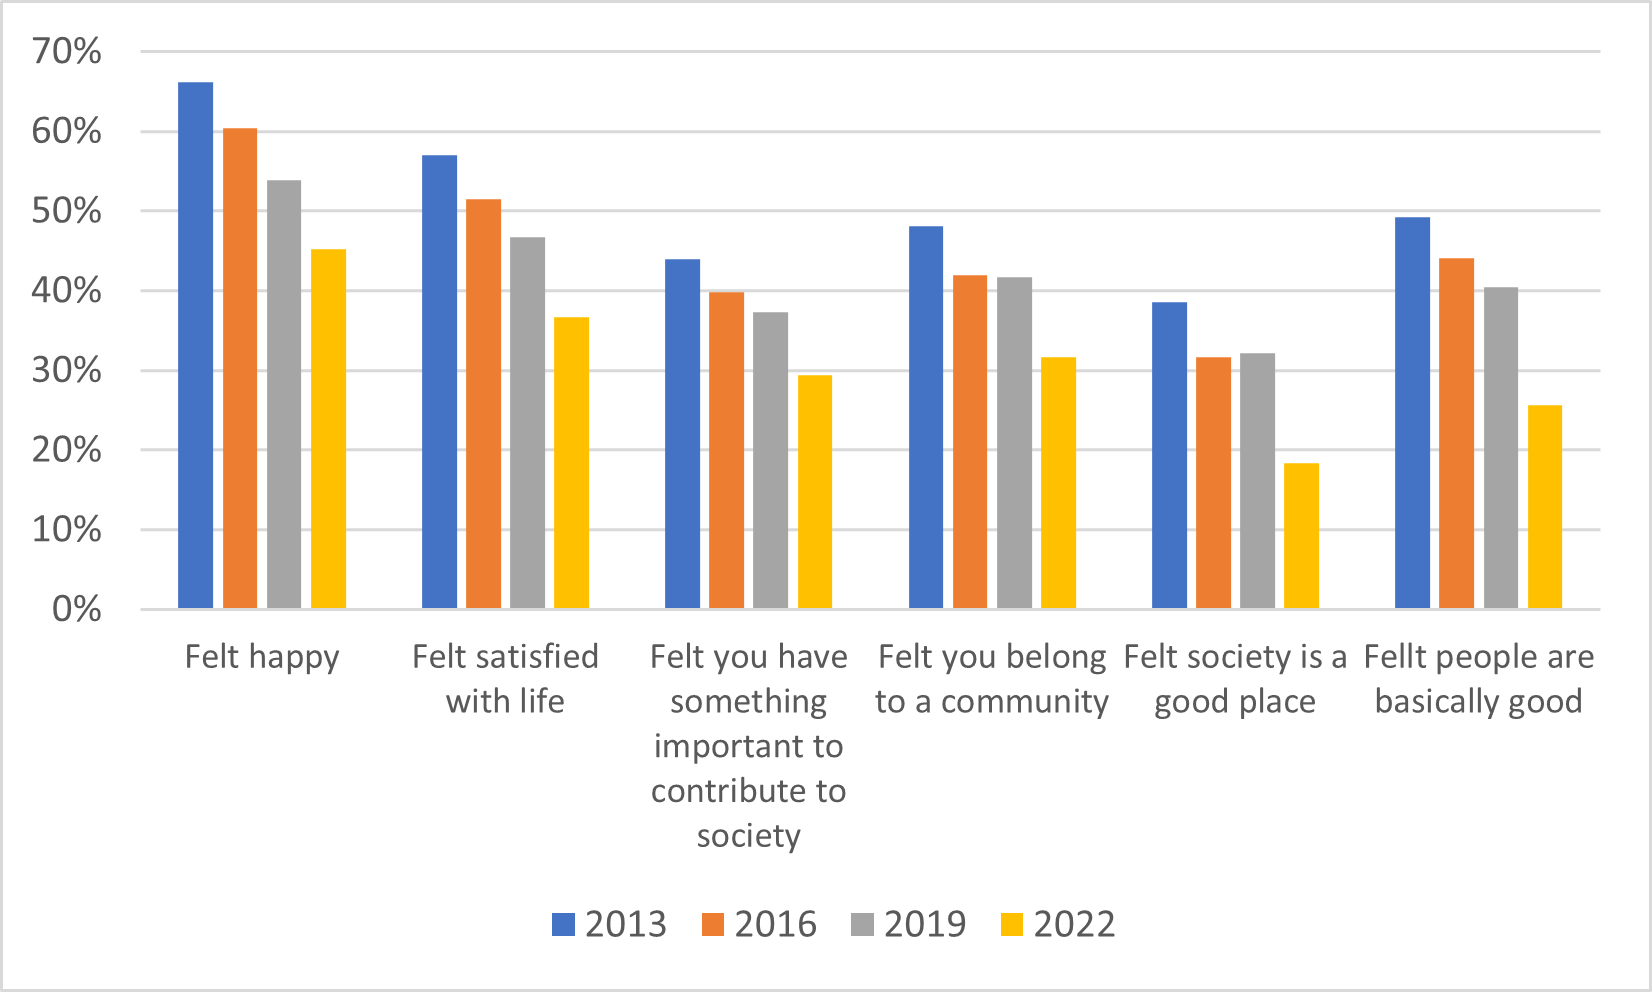
And here’s a final graph, which gives you a sense of students’ increasingly bleak outlook on life. The survey asks students “how often” in the past month they have felt a particular emotion or felt something to be true. Figure 5 shows the percentage answering “every day” or “almost every day” to a variety of statements, and across the board It’s way down. Today’s students’ collective outlook is significantly bleaker than it was even a decade ago.
Figure 5: Percentage of Students Saying Answering “Every Day” or “Almost Every Day”, to the Question “In that last month, how often have you:”
I don’t know what the relationship is between “bleak outlook” and mental health (and even if I did, I’m not sure which way the causality arrow would point). But if there is one thing to take away from all this, it is that the student body we are teaching these days is fundamentally different – fundamentally less well – from any we have seen before.

