


This is a full-on data nerd blog on faculty numbers and ratios. Normally, we would put this stuff in The State of Postsecondary Education in Canada, but StatsCan took its sweet time delivering me the data and I missed the publication of the data. But hey, better late than never, so let’s dive in.
Before we get to the numbers, some methodological notes (I told you this was for nerds). Annoyingly, StatsCan counts teachers by “Principal Subject Taught”, which is not the same thing as the Primary Field Groupings, which in my graphs you’ll see as “Broad Field of Study”. It’s not difficult to do a crosswalk between the two (you can see it here) but there are between 1-2% of profs who cannot be identified this way because they teach in interdisciplinary programs that cross the Broad Fields of Study. Also, StatsCan stopped collecting data on faculty for a few years in the early 2010s (thank you Stephen Harper) and while many institutions decided to report their data to a university-run consortium, not all did and so the years 2011 through 2015 are based on interpolation rather than hard numbers. And all the numbers are full-time professors in tenured or tenure-track positions. Don’t ask me about sessionals, because there’s no data (take it up with StatsCan)
Got all that? Ok, let’s go look at the numbers.
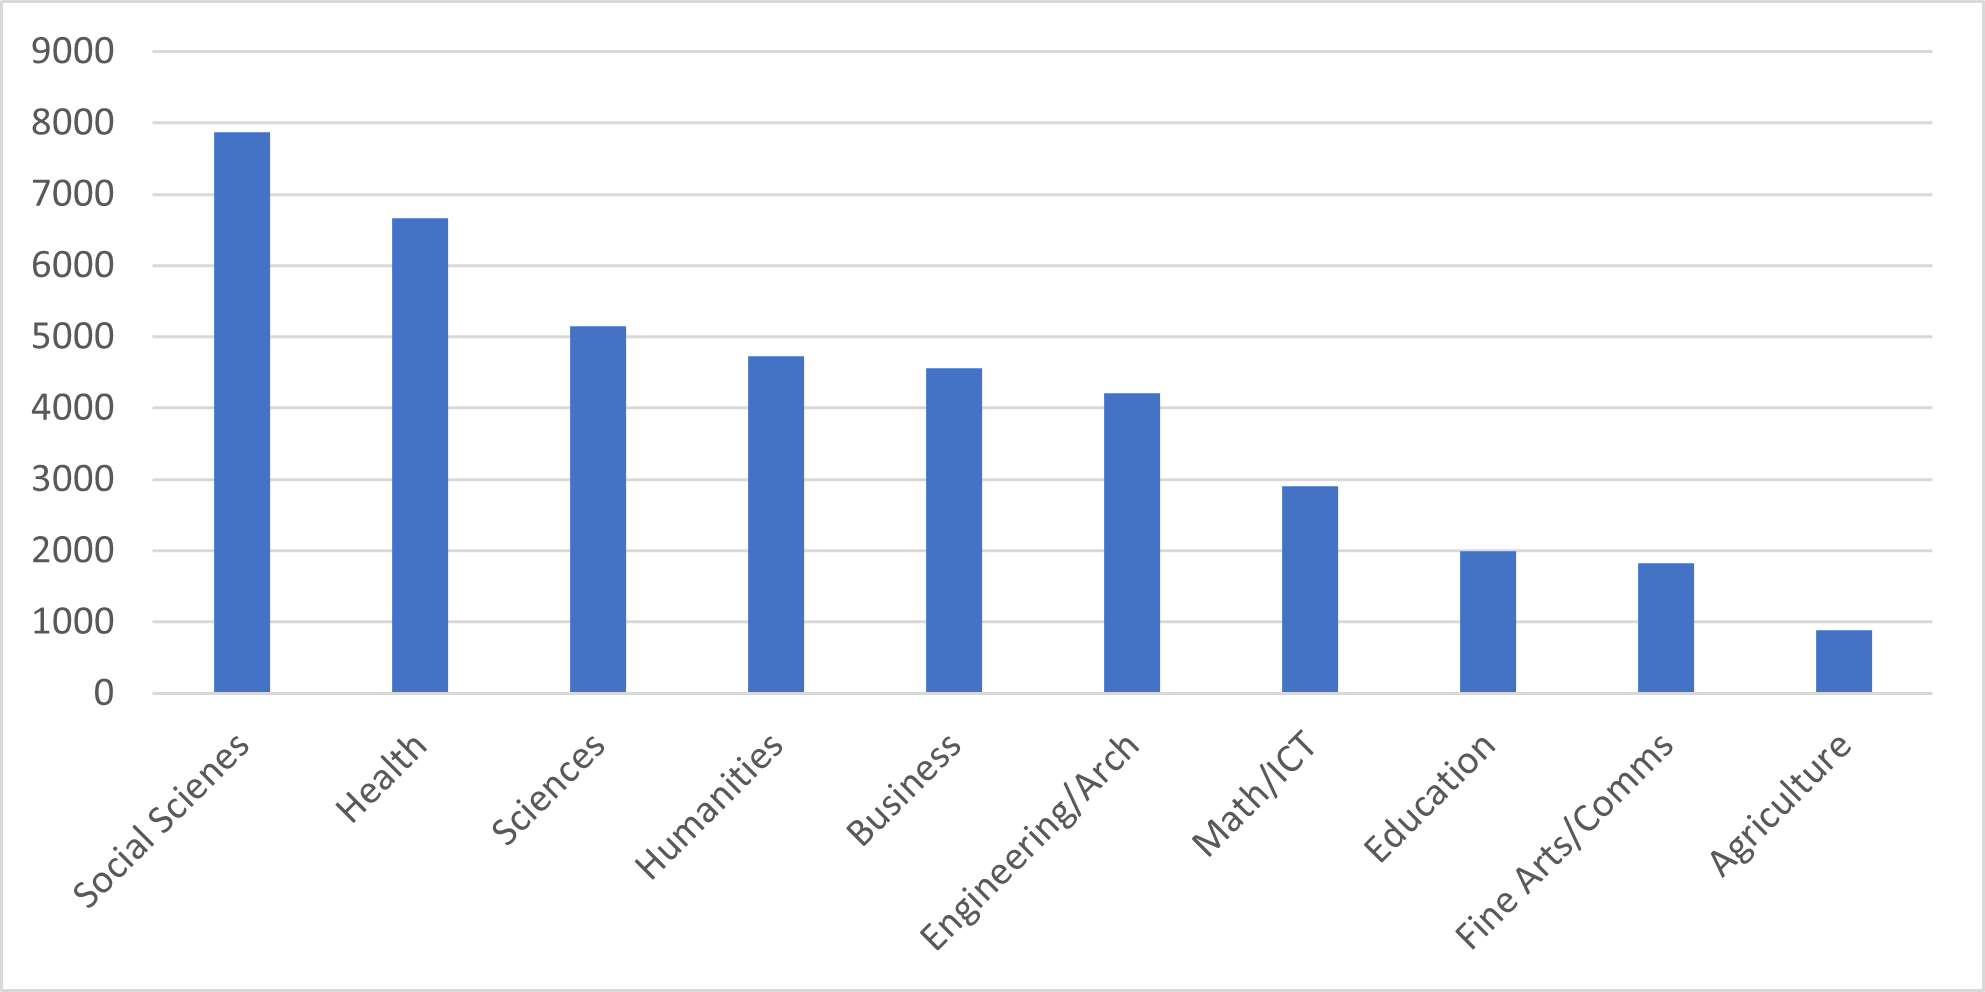
Let’s start by looking just at raw numbers. In what fields do profs teach? Figure 1 shows the distribution. Social Sciences are by far the largest field in terms of raw numbers, with just under 7900 profs; with health next at 6650. Education, Fine Arts and Agriculture are the three smallest fields.
Figure 1: Full-time Tenured and Tenure Track Academic Staff by Broad Field, Canada, 2021-22
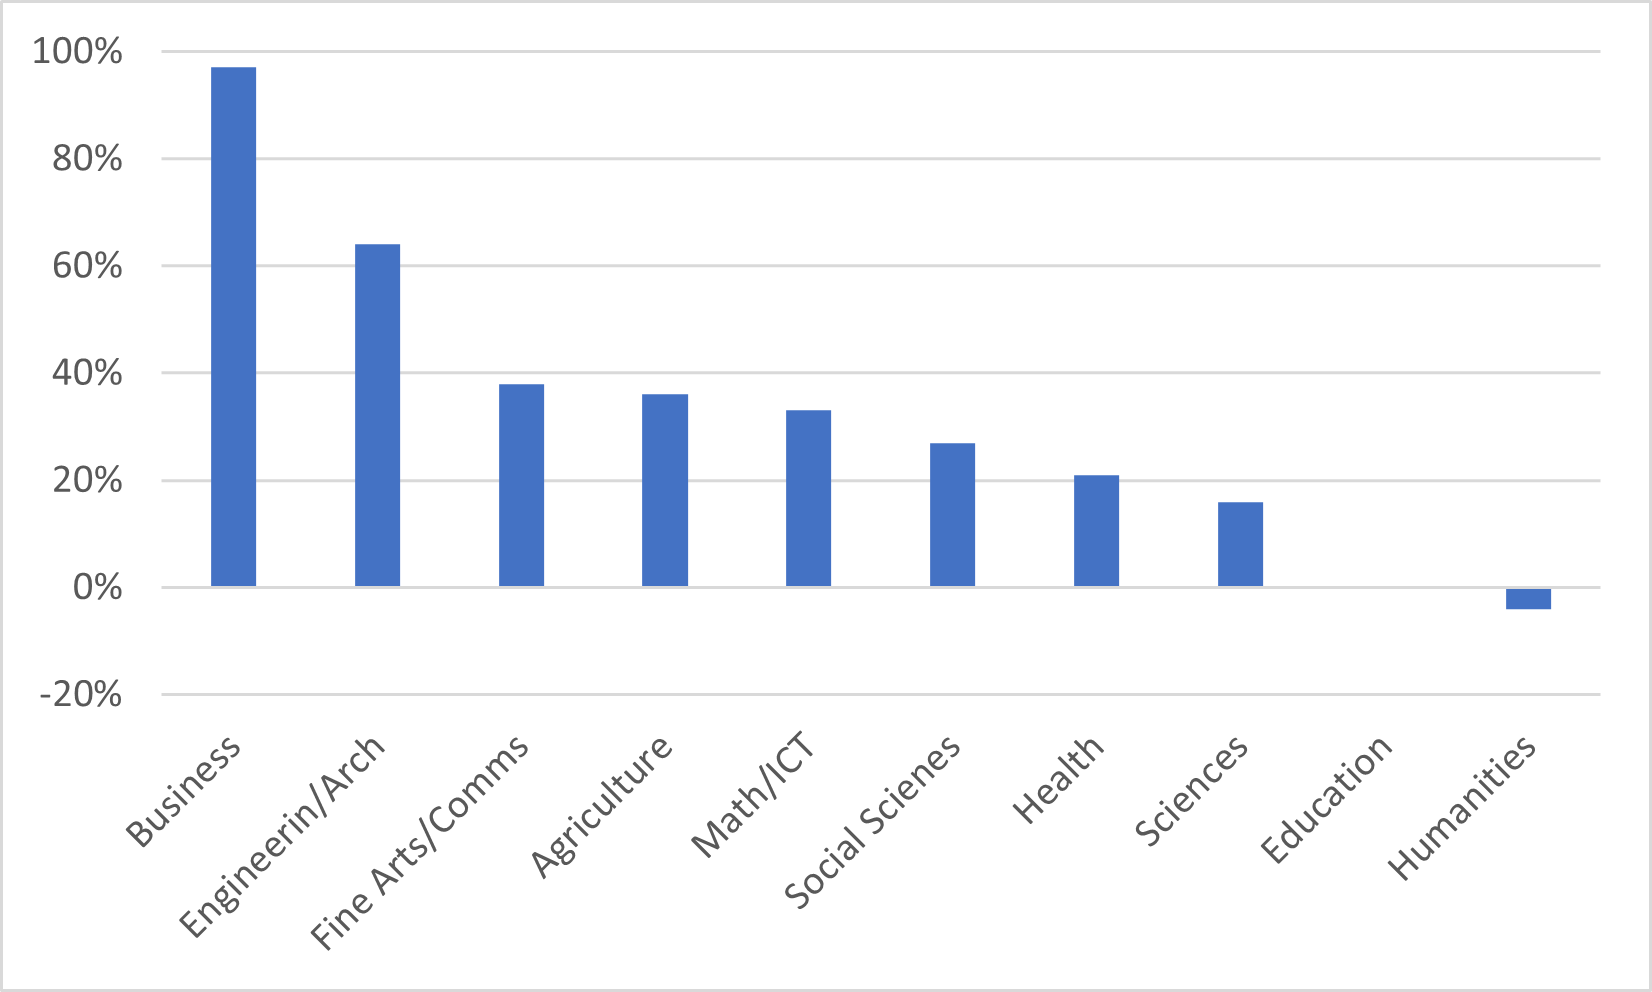
How have these numbers changed over time? Figure 2 shows the increase/decrease in fields since 1990. Except for the Humanities, where the number of faculty members is 4% lower than it was in 1990 and Education, where the number is unchanged, all fields of study have seen a growth in the number of full-time staff employed, sometimes a substantial one. The number of professors in Visual and Preforming Arts (shortened in the graph to “Fine Arts”) is up 38%. In Engineering and Architecture, the number is up 64% and in Business it is up a whopping 97%.
Figure 2: Change in Full-time Tenured and Tenure Track Academic Staff by Broad Field, Canada, 1990-91 to 2021-22
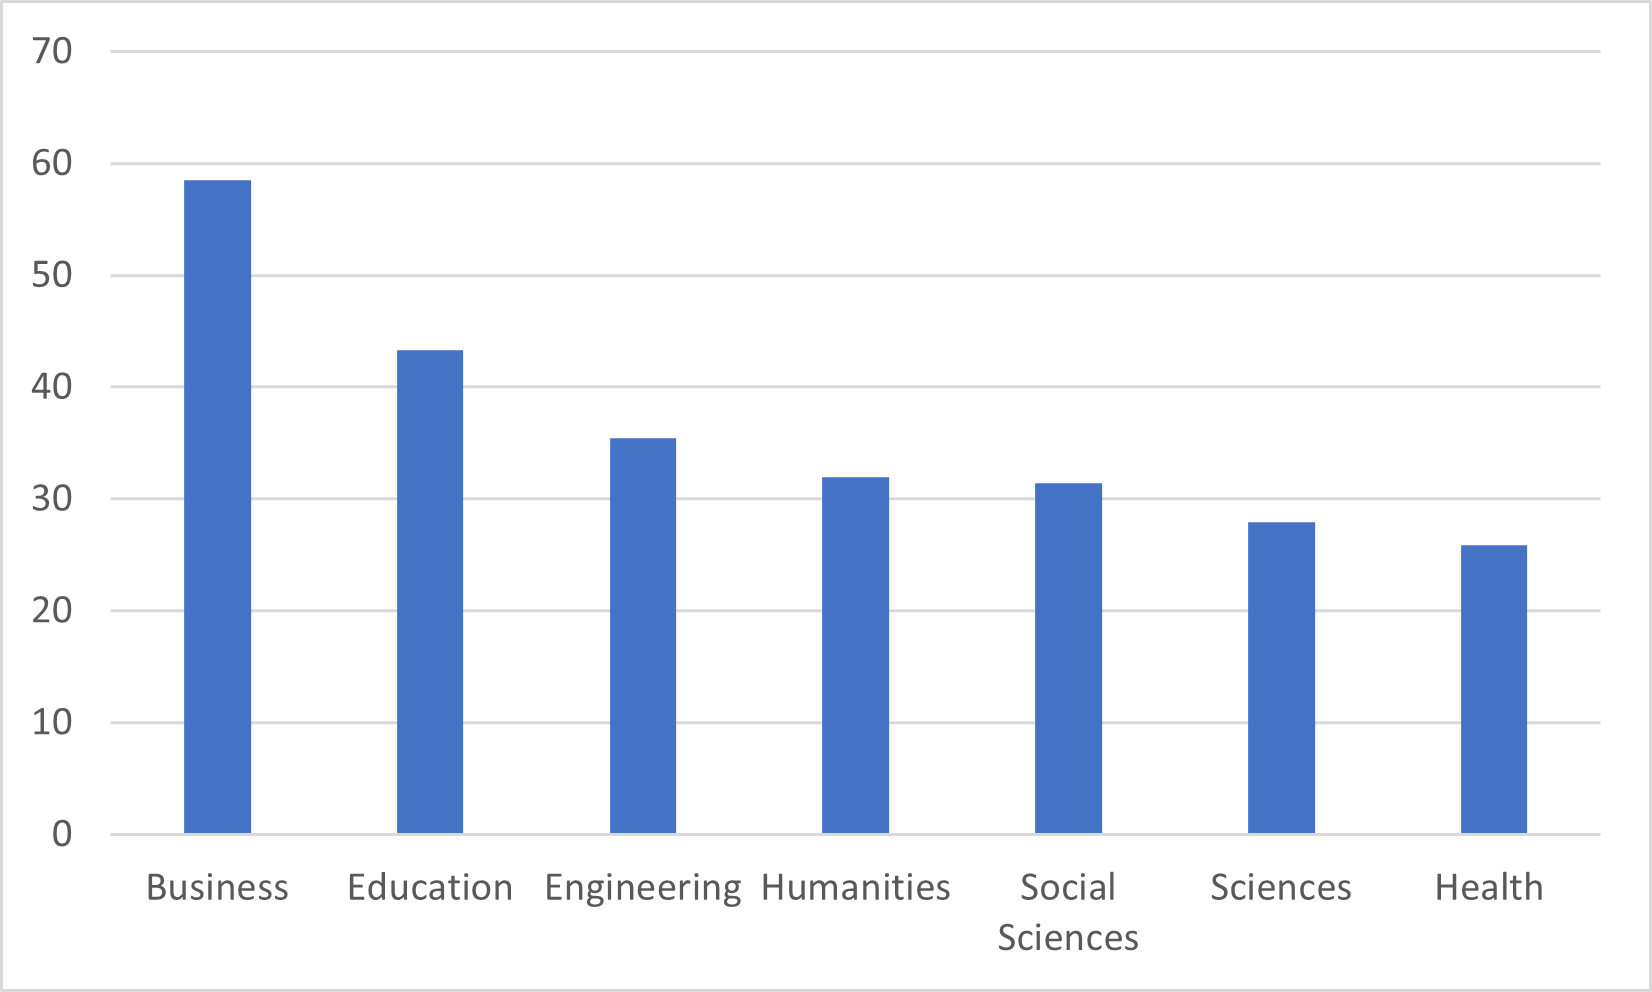
At this point, some of you might say “Hey! Usher! Put those numbers into context with some data on the number of students taught!”. Well, friend, I have you covered. Figure 3 shows the number of enrolled students per full-time tenured or tenure track academic staff members. Business is highest at 58, Health is lowest at 26, but most fields sit between 28 and 35 students per professor. (Note: for reasons too boring to recount, I have collapsed the categories “Math/ICT and “Agriculture” into the Science category for this graph and the following one).
Figure 3: Ratio of Enrolled Students to Full-Time Tenured and Tenure-Track Academic Staff, by Broad Field of Study, Canada, 2020-21
It might be tempting to go straight from Figure 3 to speculating about class sizes by area of study, but restraint is advisable. Some of these fields – quite properly, if they are professional fields – are pretty heavily reliant on sessional staff (business and health, especially). So, I wouldn’t bet the farm that actual class sizes vary in line with these numbers.
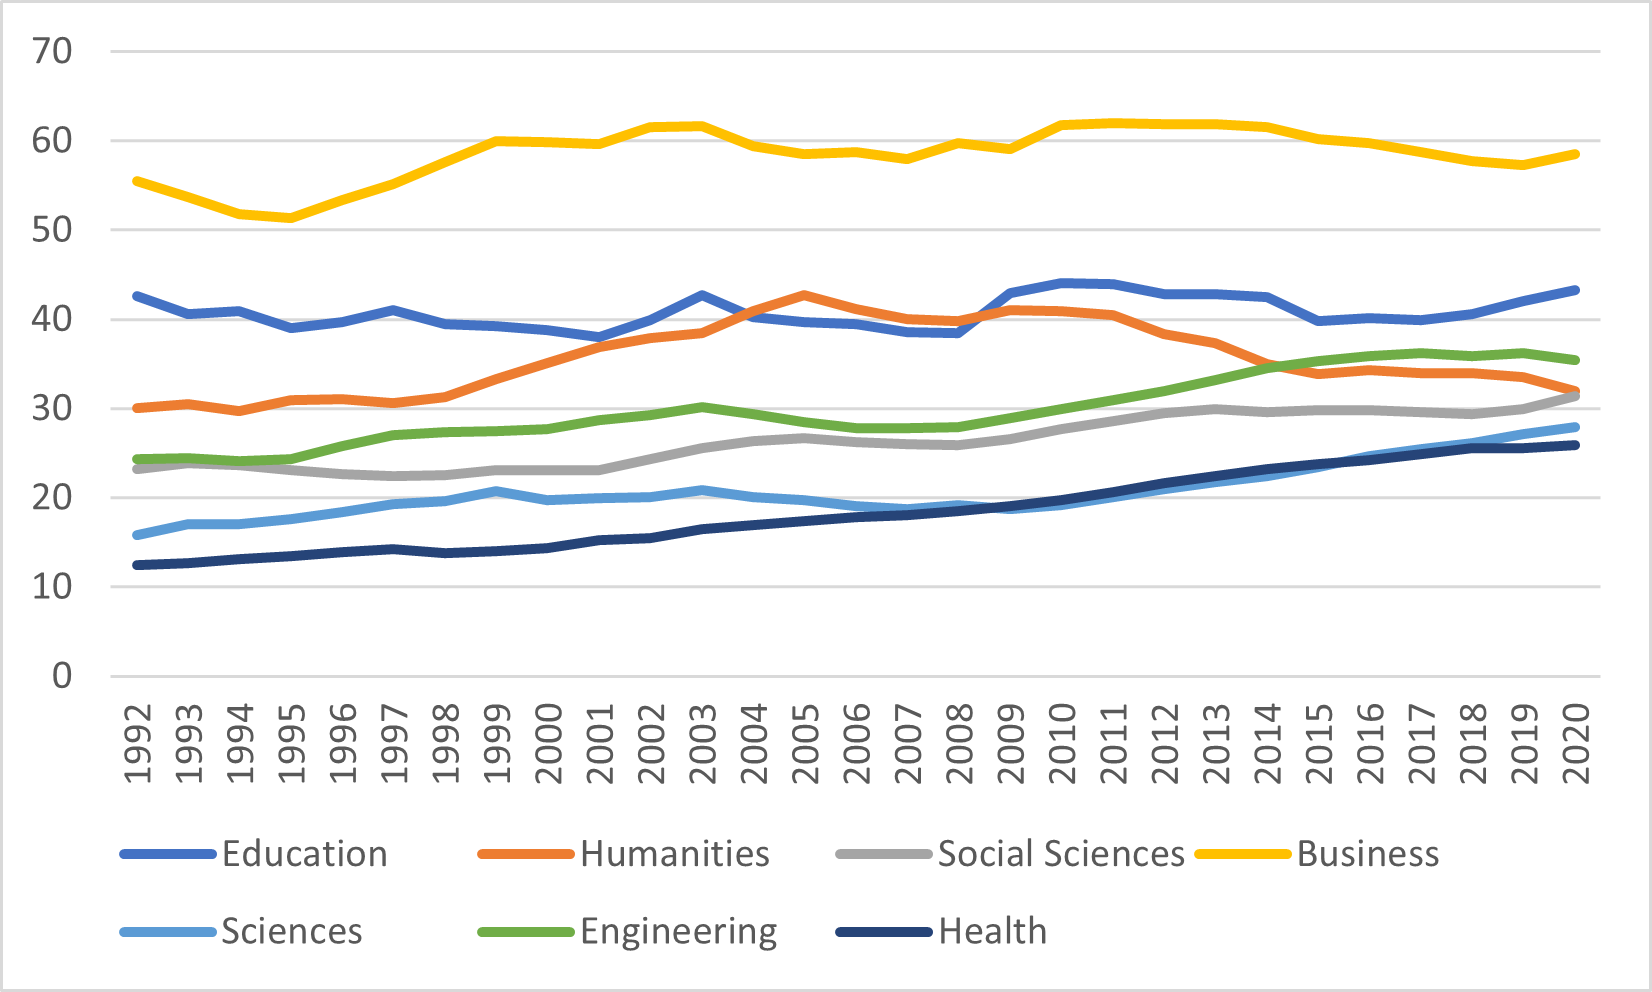
Finally, there is figure 4, which I think is pretty cool: changes in student-teacher ratios from 1992 to as-close-to-the-present-as-Statscan’s-antiquated-data-collection-process-will-allow. Three key takeaways. First, the student-teacher ratios in Business and Education have always been high and have remained broadly consistent over time. Second, most other fields – including Humanities up until the mid-2000s – have seen rising student-faculty ratios (again, that doesn’t necessarily mean rising class sizes: you’d need nonexistent data on sessionals to know for sure). Third, the one field where ratios are falling is in the humanities where enrolments have dropped faster than faculty positions in the past fifteen years.
Figure 4: Ratio of Enrolled Students to Full-Time Tenured and Tenure-Track Academic Staff, by Broad Field of Study, Canada, 1992-93 to 2020-21
If you extend the trend-line out a few years, it looks like Humanities might have the smallest student-faculty ratio by the end of this decade. I’m not convinced that’s quite how it will play out: my guess is that net retirements will probably rise a bit and student enrolments will stabilize before Humanities falls below Health. But the overall trend is striking: to the extent that you can view this particular student-faculty ratio as a measure of “efficiency” (which it is, sort of, if you squint a bit) then it’s easy to see why administrators look a bit askance at the field: over time, it’s the only field becoming less efficient over time.


5 Responses
Hi Alex — what does “enrolled students” mean in this context? Are you just looking at majors or majors and minors? Or is this the number of course enrolees in a given year?
I ask because what we conclude about class sizes depends not only on the unknown number of sessionals, but on the course enrolees in each area. A program might have 50 majors but teach many 1000s of students each year if they attract a lot of non-majors to their classes. And that is pretty common for the Humanities and some Sciences.
If I may, I believe that that argument was used by defenders of the languages at U West Virginia.
The counter-argument by the bean-counting champions of illiteracy was, as I understand it, that these students would be in the institution anyway. If (say) courses in French are no longer available, students will just take more credits in (say) Service Dog Training (which I believe UWV still offers).
Thanks for this info and analysis (as always)!
From figure 2 to 3 & 4 you note that you have ‘collapsed the categories “Math/ICT and “Agriculture” into the Science category for this graph and the following one’.
Can you clarify where the “Fine Arts/Comms” numbers were collapsed into?
Asking for selfish reasons.
Any way you can separate computer science?
Thanks, as always, for your insightful post. The lack of sessional information is really damning, though of course not your fault.
I wonder, though, if it makes the situation of the Humanities even worse than you describe: if the more popular classes — the thousands of students doing freshman comp, for instance — are sessional-taught, then retirements by full-timers wouldn’t fix the problem, as they have relatively few students to begin with. We might have to look forward to departments ceasing to be, at least in the normal sense of having tenured and tenure-stream faculty, combining teaching and research.