We all know about stereotypes when it comes to students: computer science students resemble characters from The Big Bang Theory, arts students are inordinately fond of hackie-sack, etc. But is there any truth to this?
Well, there is some, as it turns out. About a year ago we asked our CanEd Student Research Panel a series of questions about their attitudes toward academic challenges. The answers we got were interesting because of the way they broke down by field of study. Below are the answers to four questions about academic challenges for the six fields of study for which we had more than 100 observations.
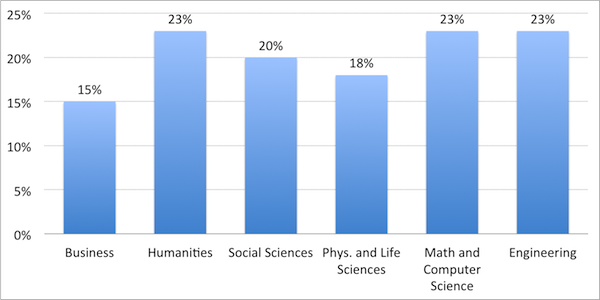
Figure 1 Strongly Agree that “Being Challenged in School is Important to Me”
Slightly fewer business students say they think being challenged in school is very important to them, but not a huge difference across fields of study
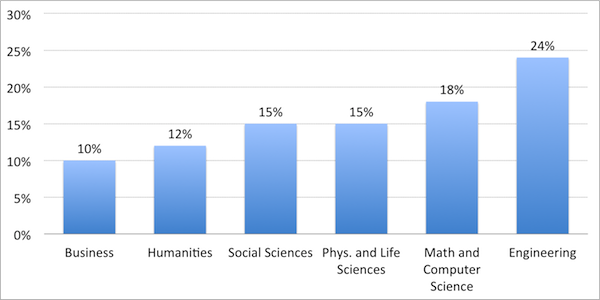
Figure 2 Strongly Agree that Classes that Require Application of New Concepts and Techniques are Enjoyable
Engineers like trying new things, business and humanities students less so.
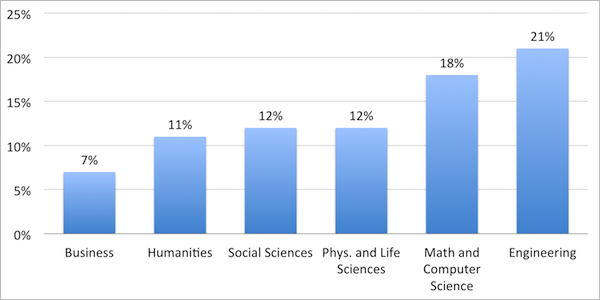
Figure 3 Agree and Strongly Agree that Courses that Require Long Hours of Work are Enjoyable
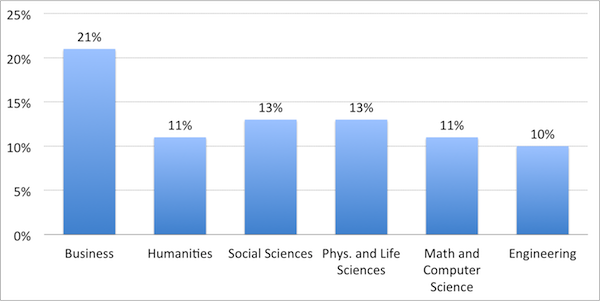
Are you getting the picture yet? This last one’s my favourite.
Figure 4 Strongly Agree that “I Prefer to Take Courses where the Instructor is an Easy Marker”
In sum, there are moderate but significant differences in academic outlook among students in different disciplines. It’s possible that these traits were acquired while in school, but I would tend towards the view that different academic disciplines simply attract different kinds of students (recall this little beauty from February?). Which in turn makes you wonder if some of the cross-disciplinary differences in learning outcomes that Arum and Roksa found in Academically Adrift were less of a reflection on the kind of education students receive in different disciplines than and more a reflection of systemic differences in learners’ personalities.


 Tweet this post

How many students were in each sample group?
What were thee figures like when you add Agree & Strongly Agree together?
@Marisa – It’s all the same sample: 2300 students in November 2010. Most of the groups are between 250 and 370 students: math/compsci is about 120.
@Kelli. The gap is about the same.