


If you’re in the looking-at-student-debt business in Canada, your data sources are limited. Provinces could publish their debt figures annually, but they don’t. Canada Student Loans does publish its debt numbers annually, but it includes nothing on provincial debt, so it’s not very useful. Statistics Canada surveys graduating students every five years, but only three years out from graduation, so the most recent data we have from that source is now five years old. Kinda sucks.
But there is one other source of data, at least for university graduates. That’s the triennial survey of graduating students from the Canadian University Survey Consortium, which just released its report on their 2015 data (Hey, Statscan! 17,000 responses, and a turnaround time of under four months!). This gives us a chance to see what’s been going on the last few years by comparing the 2102 and 2015 results.
Before I get into the results, a small caveat about the data. As its name implies, the consortium doesn’t have a fixed membership, and so comparability of results between surveys isn’t perfect. In 2012, 37 institutions participated (n= 15,111 students), and 34 in 2015 (n=18,114). Twenty-nine institutions did both surveys, but there was some churn. In terms of student numbers, the 2015 survey is biased slightly more heavily towards the Atlantic (17% vs. 13%), and less heavily towards Ontario (39% vs. 42%). Since the latter has been seeing lower average student debt of late because of its 30% tuition rebate program, one would expect a slight bias towards higher debt numbers in the 2015 survey. In both periods, the survey sample as a whole is overweight in the Atlantic, Saskatchewan, and Manitoba, and underweight in Quebec and Ontario.
Onwards. Here’s what happened to student debt incidence:
Figure 1: Percentage of Graduating Students With Debt, By Type of Debt
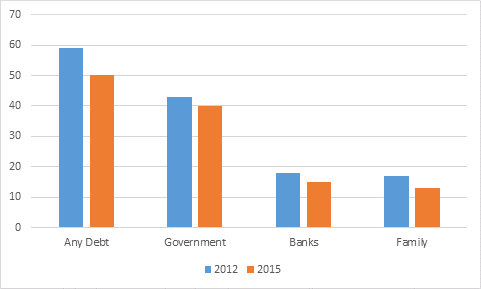
Not to beat around the bush: incidence is down. By four percentage points for family debt, three each for private bank debt and government debt, and a whopping nine percent for “any debt” (and, recall, this is with a population shift that is slightly more likely to have debt). For a three-year period, that’s a simply massive change, and one heading in the right direction.
Now, how about average debt levels?
Figure 2: Average Debt Levels (Among Those with Debt), by Source of Debt, in $2015
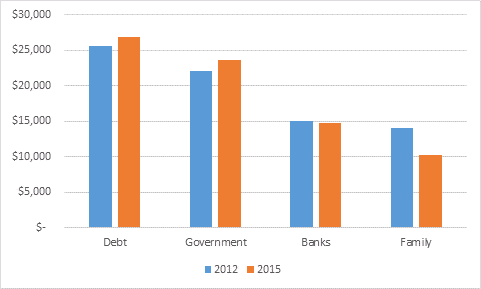
Here, we have trends going in different directions. Students are borrowing substantially less from family (for what that’s worth: in all likelihood, a substantial portion of these get forgiven), and marginally less from banks. But government borrowing is up 6% in real dollars, which more than offsets those changes. That’s a change for the worse, but it’s at least partially a product of a shifting survey base (my guess is that this accounts for about a quarter of this change). CUSC does not release data by region, but I think it’s pretty safe to say that the big increases will be found in Alberta, BC, and the Maritimes.
In other words, we’re mostly seeing a continuation of trends that NGS has been showing for a decade now: average debt is rising slightly, but debt incidence is falling (while enrolments are rising, which is counter-intuitive).
Takeaway: As inconvenient as this may be for the hell-in-a-handbasket crowd, there is still no student debt crisis.

