


Today, I will round out our rankings week by looking at the Quacquarelli Symonds (QS) Rankings. These rankings have always been similar to the THE World University Rankings, because they spring from the same source: QS was the organization that actually ran the THE rankings for a few years, and when THE decided to bring the data operation in-house, QS just kept producing its rankings. Like THE, its indicators for university rankings used are mostly a mix of field-normalized bibliometrics and surveys of academics, with a sprinkling of other institutionally-supplied data on metrics like international proportions of staff and students. To the extent there is something distinctive about QS rankings it is that it has long run a second survey, among employers, to score institutions on “employability”, to feed an indicator worth X% of its rankings.
THE and QS have dueled each other in a number of ways over the past fifteen years. Remember, these are – effectively – dueling consulting firms, with the rankings product simply a loss-leader to sell data services to universities. Both got into regional rankings in the early ‘10s to expand their list of clients, mainly but not exclusively in Asia. And both expanded into subject or field rankings at about the same time for similar reasons. So, when THE expanded into “Impact” on Sustainable Development Goals, it presented something of a challenge to QS – should it also create a second ranking? Or should it stick to one ranking but shift the methodology in the direction of something related to sustainability?
In effect, it did both. The first thing QS did was to create a “Sustainability Ranking”, which, if we’re honest, is kind of a low-cost version of the THE’s Impact Rankings which I covered yesterday. It has a similar mix of bibliometric and “scored” indicators: the principal differences are i) they aren’t organized thematically by SDG, and ii) institutional policies aren’t really scored – you either get a point for having a policy or 0 points for not having one. I’m not a huge fan of the THE’s scoring-in-conditions-of-complete-secrecy approach, but it’s got to be better than this. 700 institutions participated in the first go-around of these rankings, and surprise!, Canadian universities did well – Toronto #2 overall, UBC #3 and Western #17. These rankings got very little public attention when they were released, and I get the impression that some of the institutions that did very well were not keen to give it publicity because they found it irritating from a data-collecting perspective.
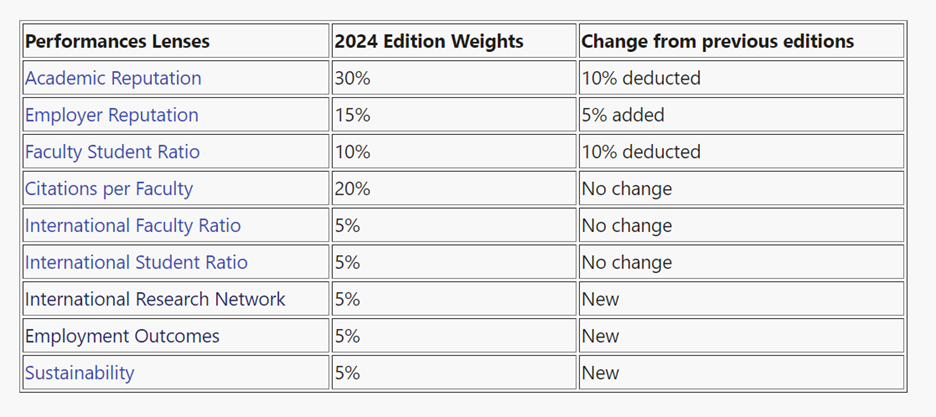
In any event, once this new ranking was completed, QS turned around and made three substantive methodological changes to the main set of university rankings. The first was to add a new indicator for sustainability – which was just the university’s score on the separate sustainability ranking. The second was to create an indicator for employment outcomes. This is in keeping with QS’ shtick about being the “employment-focused” ranking, but the consistency of data quality on this metric is so bad it’s pretty hard to credit. And the third change was to introduce a new metric designed to measure the diversity of international research networks. This measure is so wonky I must quote straight from the QS methodology page:
The IRN adapts the Margalef Index, widely used in the environmental sciences, to estimate the richness of international research partners for a given institution. IRN Index reflects the ability of institutions to diversify the geography of their international research network by establishing repeated research partnerships with other higher education institutions. It also reflects the efficiency of this as we look at the diversity of partner locations against the efforts needed to achieve such a diversity. Specifically, the QS International Research Network (IRN) Index is calculated with the following formula:
IRN Index = L / ln(P), **
where In(P) is the natural logarithm of the distinct count of international partners (higher education institutions) and L is the distinct count of international countries/territories represented by them.
Confused? You’re not alone. Here’s my shot at an explainer. First, “international research partners” is the number of institutions outside your country at which your academic staff’s international co-authors work. If your staff have 200 international co-authors in a given year, you get maximum points if they are located in 200 different countries, and minimum points if they are all located in the same country. Yes, this is a deeply idiosyncratic metric, but that’s what QS thinks is worth rewarding.
Anyways, as a result the overall ranking changed quite a bit between the 2023 and 2024 iterations (QS rankings are like automobiles, they are numbered a year ahead). In total, about 20% of the value of the 2023 indicators were redistributed to either existing or new indicators. Broadly, it made the university less prestige-oriented (by de-emphasizing the survey) and less input-oriented (by de-emphasizing faculty-student ratio), both of which are good IMHO, but it did so by adding some new elements which add to the complexity of institutional data submission and which in a couple of cases seem a close-to-the-edge from a data quality point-of-view.
Now, if you’ve ever spent any time around rankings, you’ll know two things. First, any change in methodology is likely to produce some shifts in rank order. Not at the very top (it’s hard to overcome the advantages of places like Oxford, Harvard or Stanford), but as you get out of the top 50, scores are so close together that it doesn’t take much of a shift to change ordinal rankings. And second, no one outside the Order of Rankings Wonks ever pays the slightest bit of attention to methodology changes. And so, in a very real way, comparing the 2024 QS rankings to the 2023 is apples-to-oranges, but no one doing the comparing really understood that this was the case. So for instance, McGill was very happy to announce it had cracked the world top #30, U of Ottawa crowed about its jump of 34 places, etc. My guess would be that all the institutions which participated in the Sustainability Rankings received a significant bump while those that did not were starting off with an immediate 5-point deduction. Korean institutions got pummeled, with all but one of their institutions falling under the new ranking system. This led that countries universities to declare a mass boycott of the QS rankings, which was kind of exciting.
Anyways, the upshot of this is that the main QS ranking is now methodologically much more distinct from the THE rankings that it used to be, and in ways which gently benefit Canadian universities.

