


All right, we’ve done seven of these and it’s time to look at Canada’s outlier province. You know, the one where every time you try to explain Canada to someone in another country and you have to say “of course, it’s usually different in Quebec.”
Let’s start with student numbers. Quebec is, relatively speaking, the least university-based system in the country. Just under 45% of all postsecondary students in the province are enrolled in CEGEPs, and as recently as 2001-02 university students were a minority in the post-secondary system. Note that this is not to say that Quebec has the largest college sector in absolute terms: that honour has gone to Ontario since 2007.
Figure 1: Full-time Equivalent Students, by Sector, 2000-01 to 2019-20
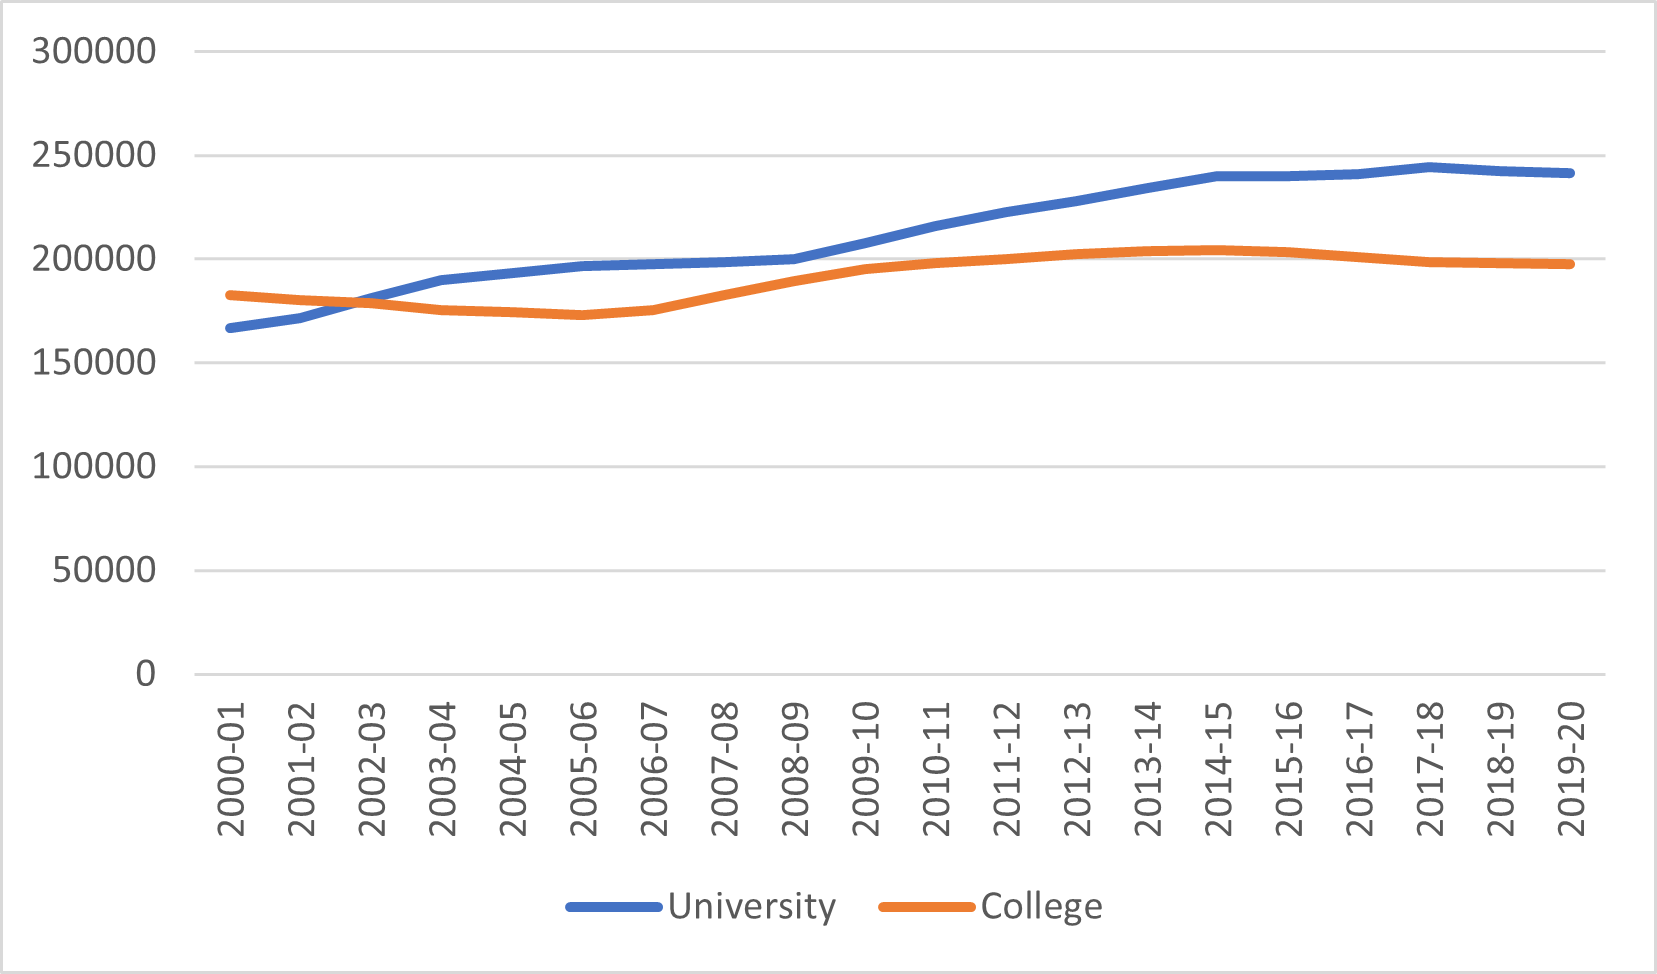
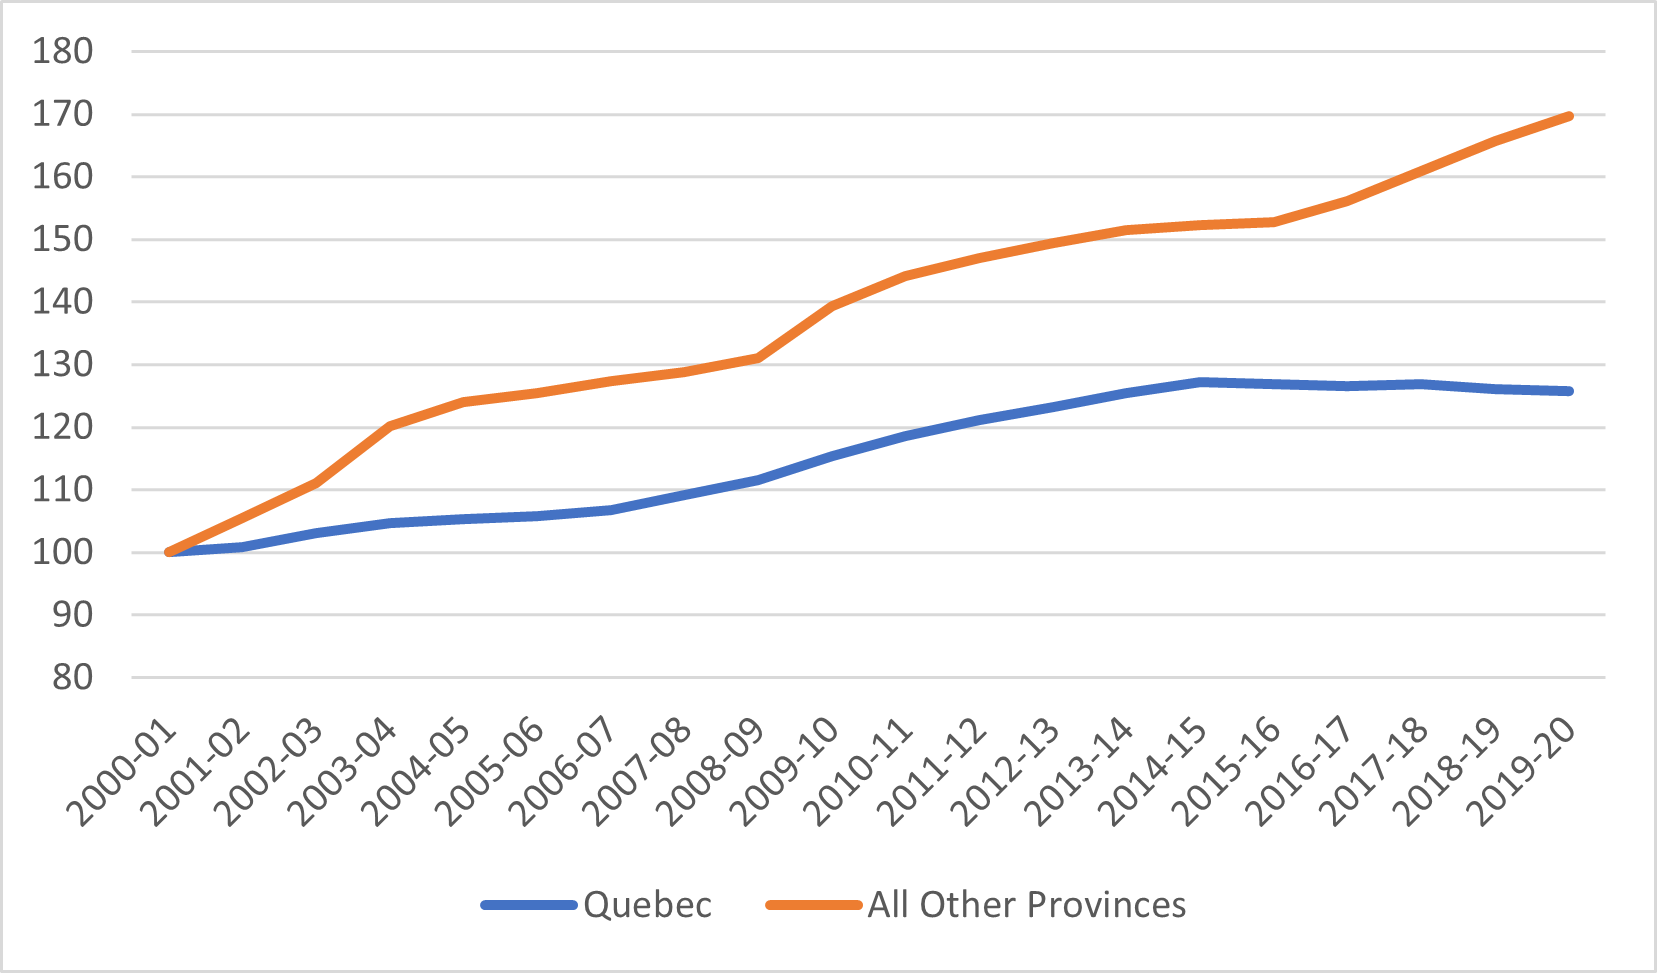
The comparison with Ontario becomes more interesting when you look at student number growth over the past 20 years. In Ontario, student numbers have doubled over the last twenty years, leaving the national average in the dust. In Quebec, on the other hand, the total number of students increased by only 26%, which lags the national average considerably. This complicates the narrative that the more “statist” Quebec model is superior to the “neoliberal” Ontario one, since Ontario’s student number growth is four times that of Quebec.
Figure 2: Indexed Full-Time Equivalent Post-Secondary Students, Quebec vs Other 9 Provinces, 2000-01 to 2019-20 (2000-01 = 100)
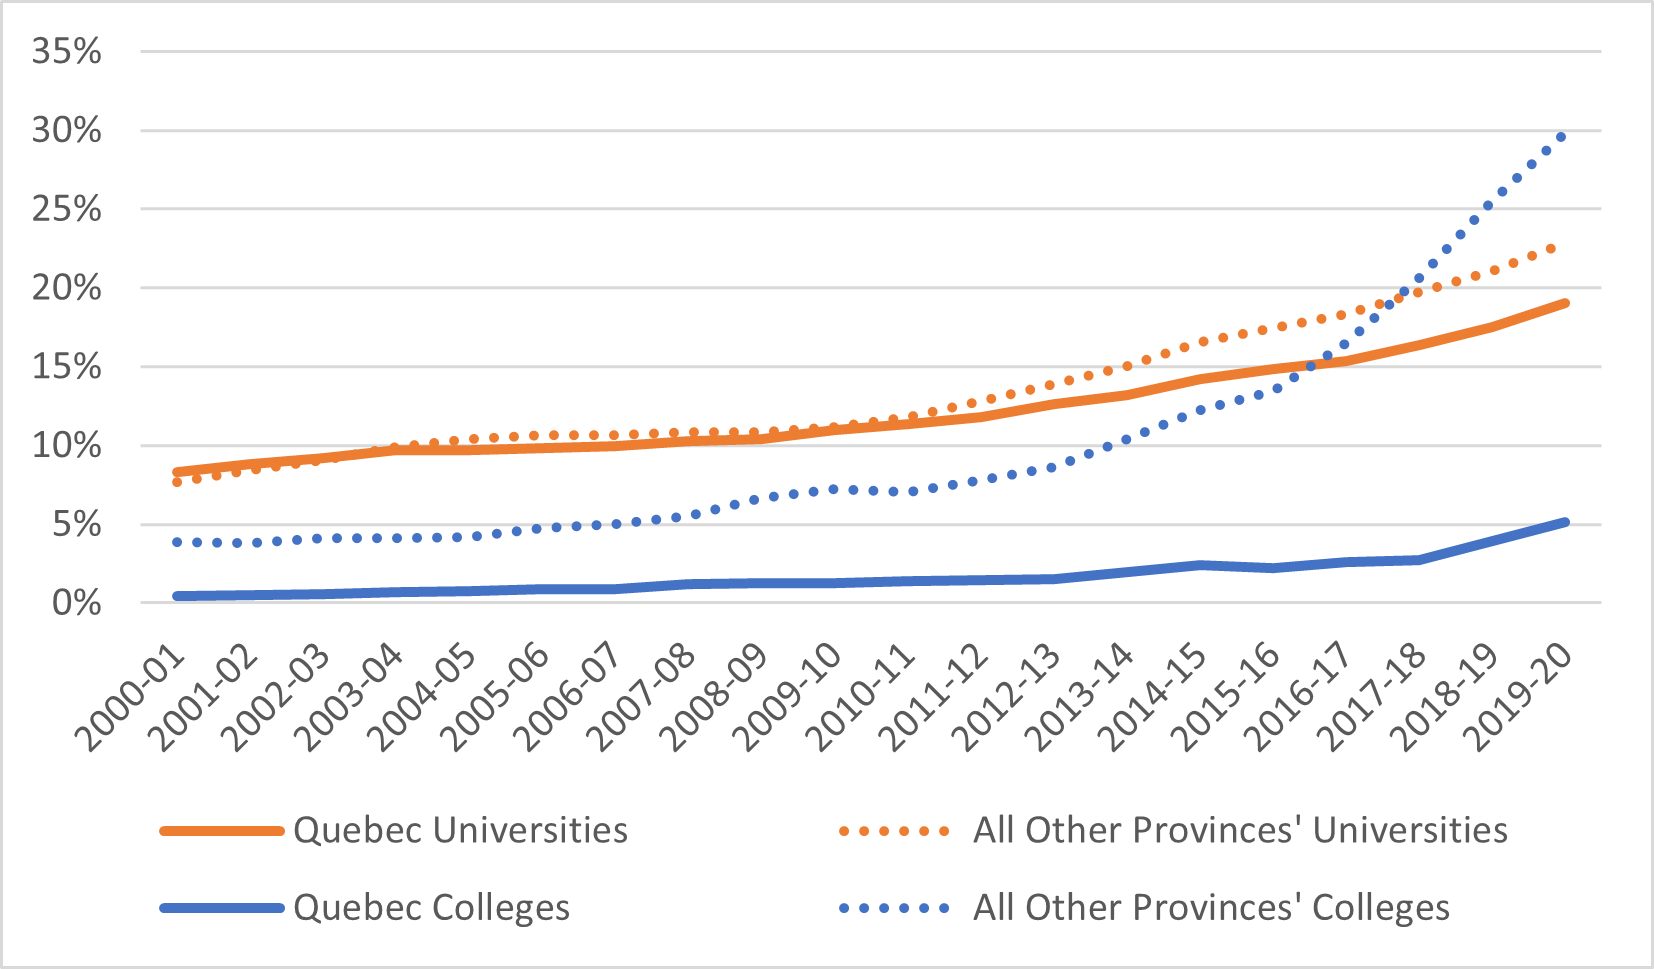
Quebec’s universities have long been home to large numbers of international students, particularly member countries of la francophonie, which have concessionary tuition arrangements with the province of Quebec (though they are not quite as generous as they used to be). The province has therefore had international student numbers equal to the national average until quite recently, when it has fallen behind slightly. At the college level, however, it is a different story: Quebec’s unique CEGEP system issue credentials which mean something in Quebec, but are almost totally meaningless outside the province, let alone outside the country. As a result, international students have little reason to enrol in the system and numbers in this sector trail the national average by a wide margin.
Figure 3: Proportion of Students from Outside Canada, by Sector, Quebec vs other 9 provinces, 2000-01 to 2019-20 (2000-01 = 100)
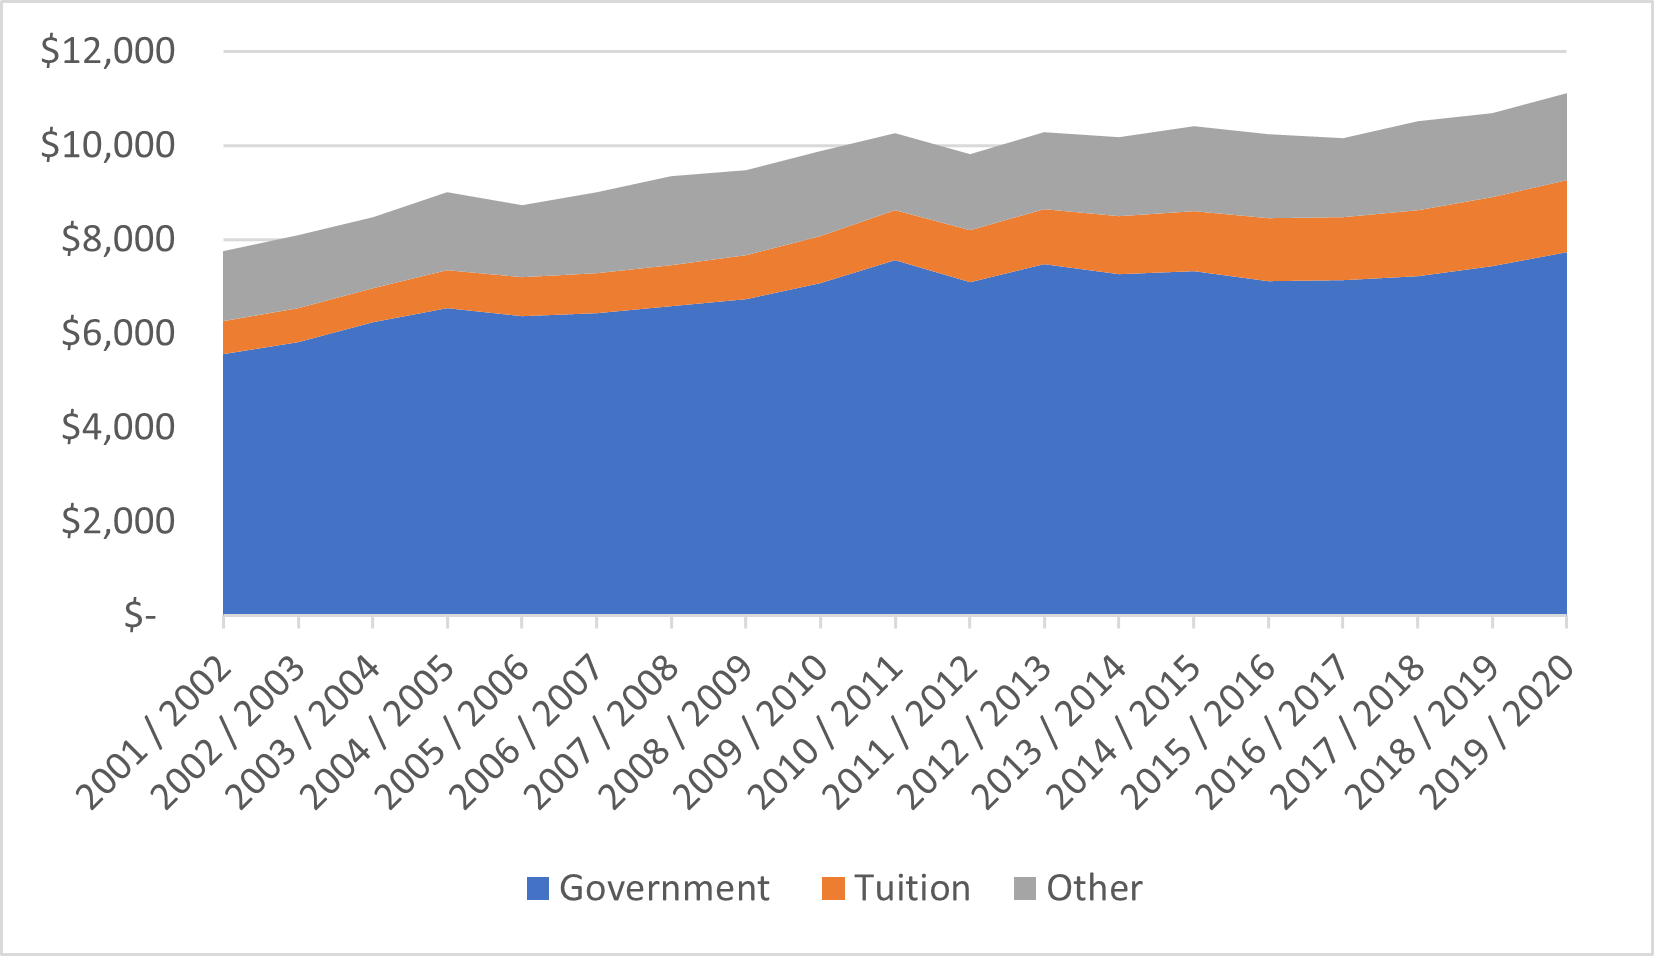
Turning to funding, Quebec’s situation looks quite unlike any province other than Newfoundland and Labrador. Public spending has accounted for about 70% of total institutional revenue since the turn of the century (compared to about 34% in Ontario in 2019-20). However, the rate of overall institutional revenue growth has been slower in Quebec than elsewhere: about 44% in real dollars compared to 101% in Ontario. As a result, total dollars per student have been growing slightly faster in Quebec than in Ontario, but slower than in provinces like Newfoundland and Alberta.
Figure 4: Total PSE Institutional Revenue by Source, Quebec, 2000-01 to 2019-20, in millions of constant $2019
As Figure 5 shows, overall growth in levels of both public funding and tuition revenues have lagged in Quebec compared to the rest of the country for most of this century. On the public funding side, rates of increase have risen recently, so that public funding in Quebec have caught up to the rest of the country in recent years. With respect to tuition revenues, rates have lagged, but not by as much as many might think. This is due to two reasons: first, as Figure 6 shows, while domestic tuition fees in Quebec are low, in relative terms they have been rising at roughly the same rate as those in the rest of the country. And secondly, while international student numbers have slightly trailed the rest of the country, rising fees for international students have offset this somewhat.
Figure 5: Indexed Change in Institutional Income from Governments and Tuition Fees, Quebec v. Other 9 Provinces, 2000-01 to 2019-2020 (2000-01 = 100)
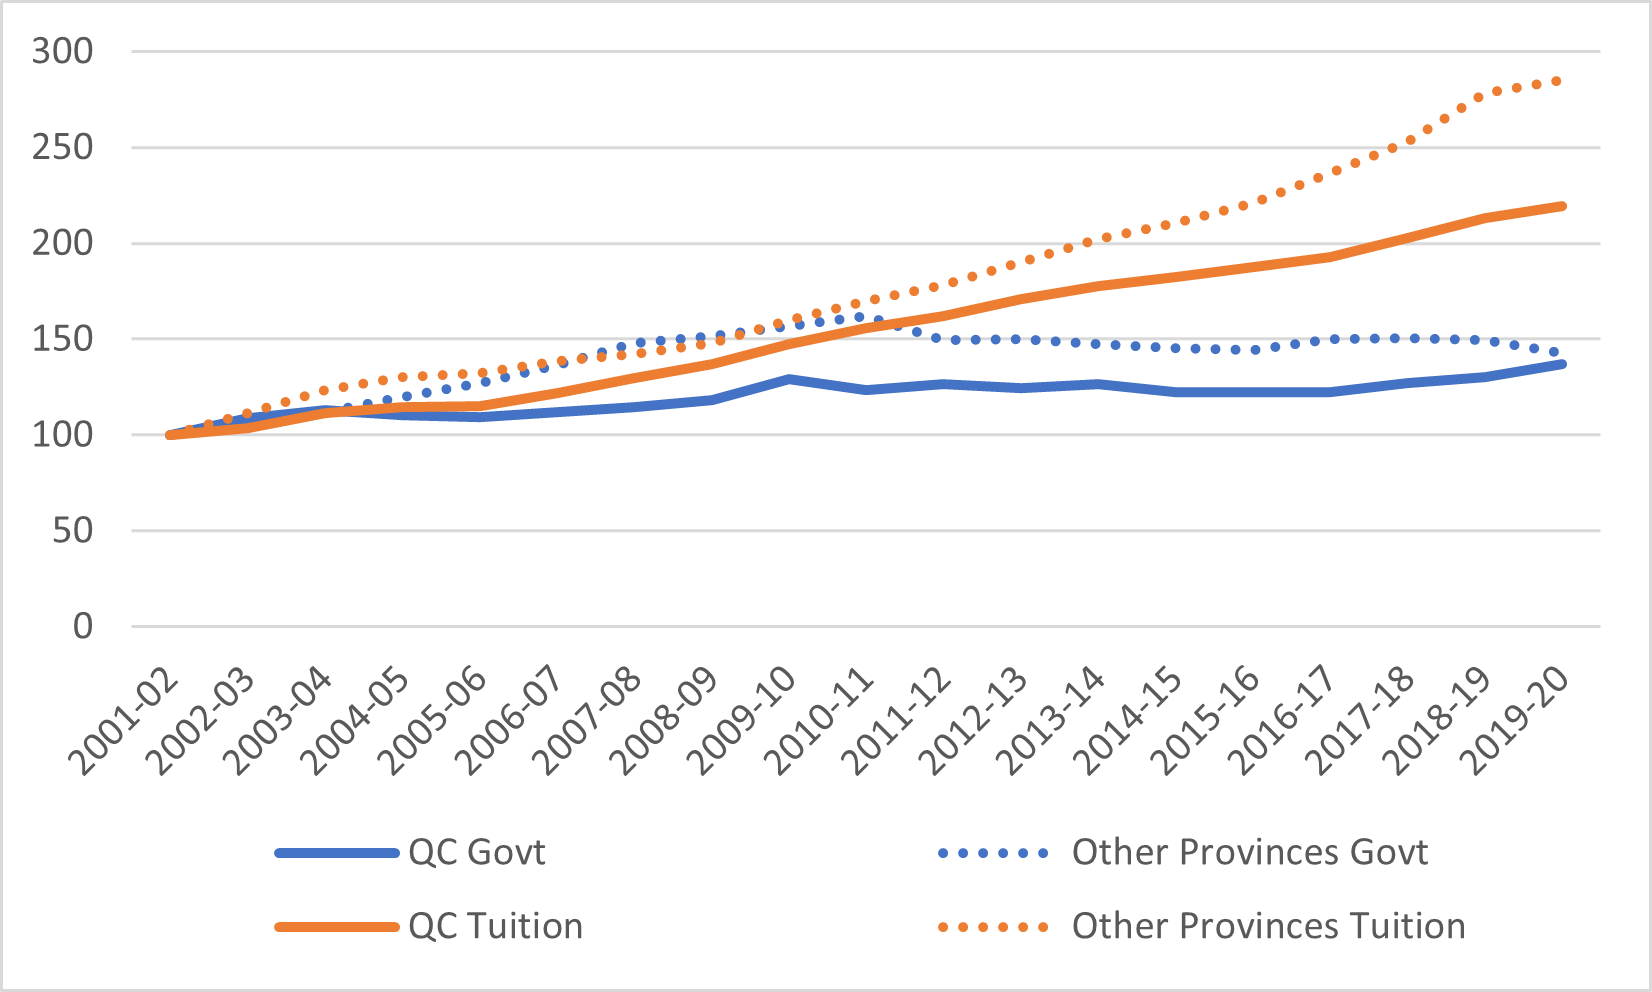
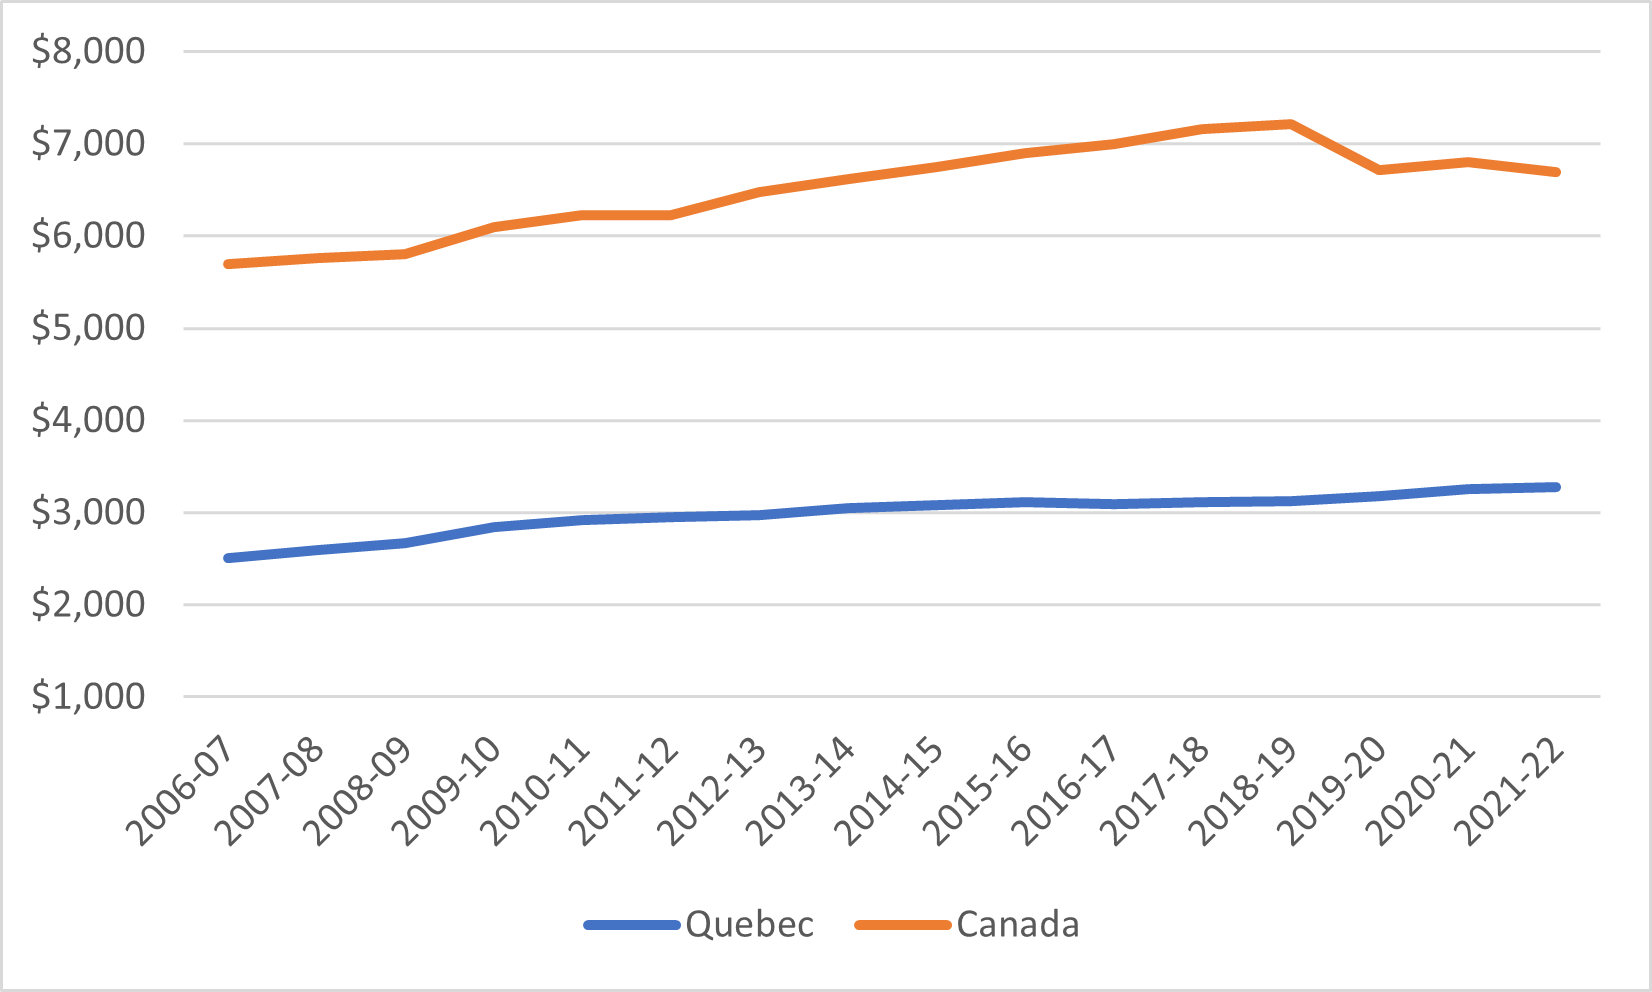
Figure 7 shows the average loan per recipient plus average grant per recipient over time in Quebec (this is not quite the same as an average aid package because not all loan recipients also receive grants). This is an area in which Quebec looks very different from the rest of the country. Total aid packages were slightly lower than the rest of the country (about $9,000 per year for most of the last decade), but the real difference is in the loan/grant mix; alone among Canadian provinces, Quebec students receive more of their aid in grants than loans.
Figure 7: Average Loan Plus Average Grant Disbursed, Quebec, 2011-12 to 2019-20, in constant $2019
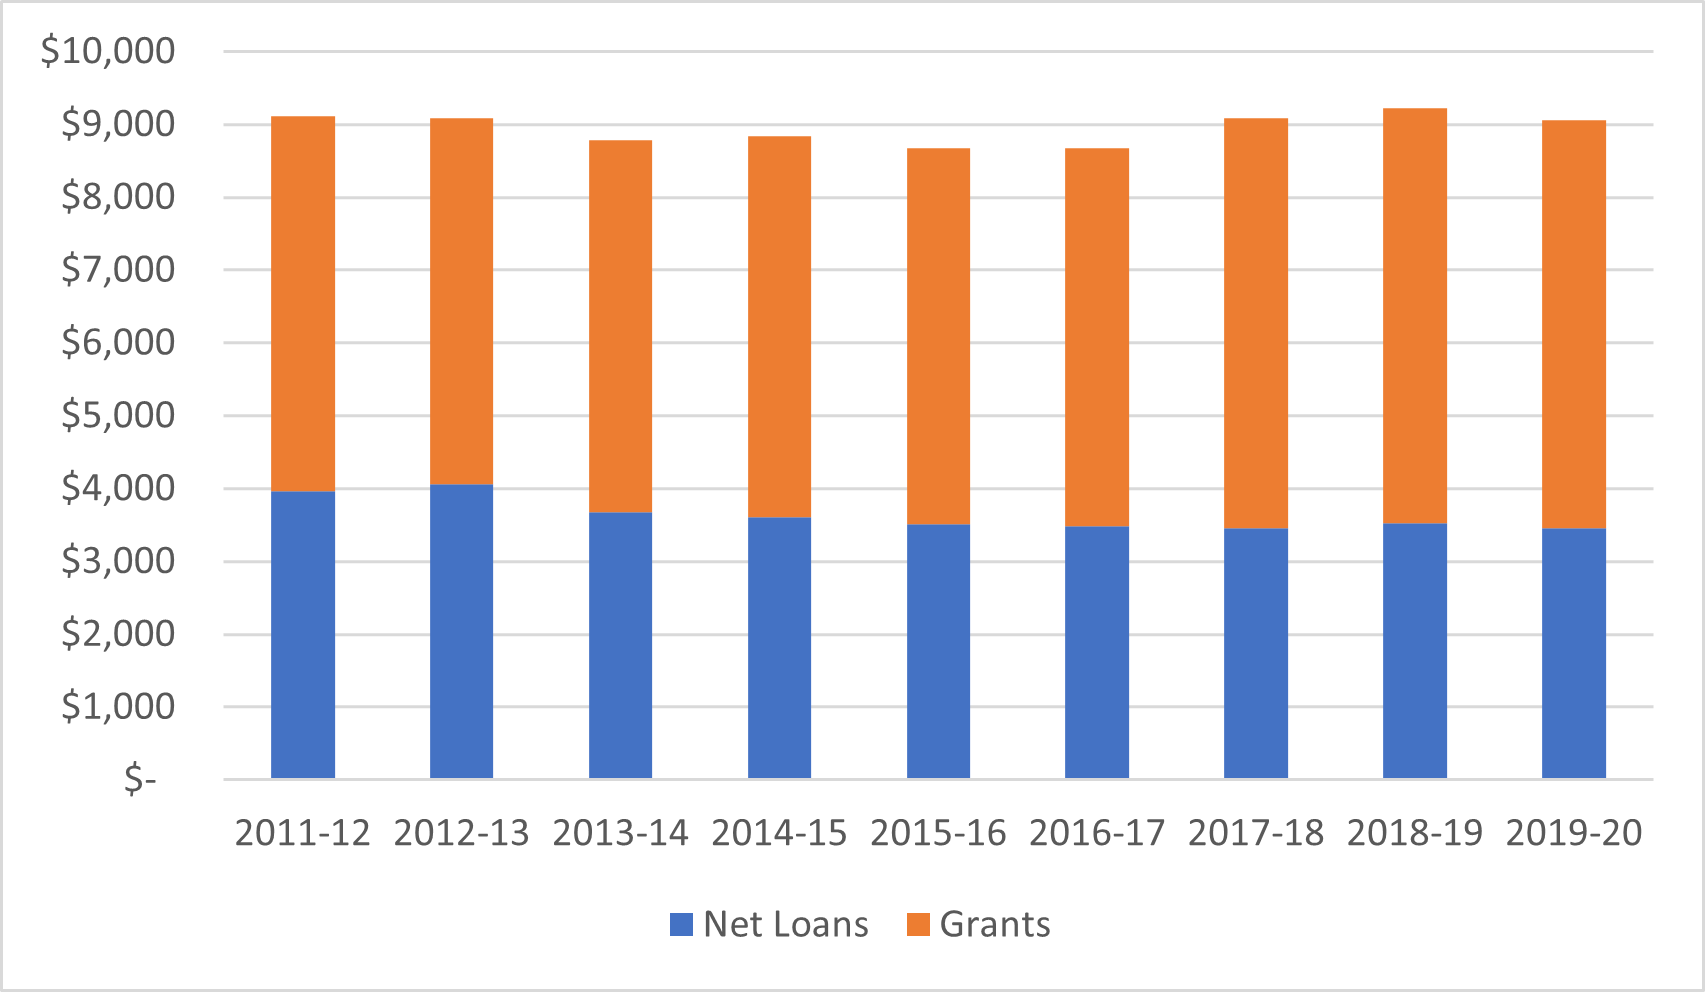
Figure 8 is in some respects a corrective to Figure 7. Though Quebec is generous in its student aid policies, the rest of the country is starting to catch up. In real dollars, loans in Quebec have been decreasing in total value (despite a growing student clientele). And while grants have increased, they have done so by less than the increase in student numbers (indeed, they have been falling since 2017-18) and by less than the increase seen elsewhere in the country.
Figure 8: Indexed Change in Total Real Provincial Loans and Grants Disbursed, Quebec vs. Other 9 Provinces, 2011-12 to 2019-20 (2011-12 = 100)
So that’s Quebec in a nutshell. Generous in terms of public funding, certainly, but also trailing the rest of the country in terms of enrolment growth.

