


A couple of days ago, after looking at employment patterns among recent graduate using Ontario graduate survey data, I promised a look at broader youth labour market data. I now wish I hadn’t promised that because Statistics Canada’s CANSIM database is an ungodly mess and has got significantly worse since the last time I tried to use its data. Too little of the data on employment and income allows users to focus in by age *and* education level, and even getting details down to 5-year age brackets (e.g. 20-24, 25-29), which might be useful for looking at youth labour markets, is frustratingly difficult.
(WHY CAN’T WE HAVE NICE THINGS, STATSCAN? WHY???)
Anyways.
Ok, so let’s start by looking at employment rates. Figure 1 looks at employment rates for Canadians in the 15-19, 20-24 and 25-29 age brackets since the turn of the Millennium.
Figure 1: Employment Rates by Age-group 1999-2016
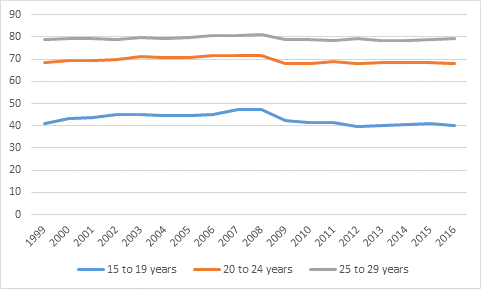
The takeaway in figure 1 is that by and large employment rates are steady except for one big hiccup in 2008-9. In that year, the employment rate for 24-29 year olds fell by about two percentage points, that for 20-24 years olds fell by three and a half percentage points, and that for 15-19 year olds by five percentage points. Not only did the size of the drop vary inversely with age, so too has subsequent performance. Employment rates for 25-29 year-olds and 20-24 year olds have held fairly steady since 2009; those for 15-19 year olds have continued to fall, and are now over seven percentage points off their 2008 peak.
Ah, you say: employment is one thing: what about hours of work? Aren’t we seeing more part-time work and less full-time work? Well, sort of.
Figure 2: Part-time Employment as a Percentage of Total Employment, by Age-group, 1999-2016
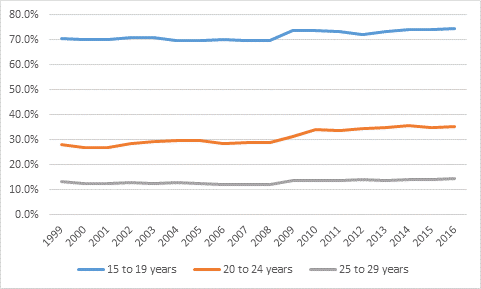
Across all age-groups, the percentage of workers who are part-time (that is, working less than 30 hours per week) rose after 2008. In the case of the 25-29 year olds, this was pretty minor, rising from 12% in 2008 to 14% today. Among the 15-19 year-olds the movement was not especially large either, rising from 70 to 74% (remember, we *want* these kids to be part-time: they’re supposed to be in school). The biggest jump was for the 20-24 group – that is, traditional-aged students and recent graduates – where the part-time labour jumped from 29% to 35%. Now some of that might be due to higher university enrolment rates (workers are more likely to be part-time if they are also studying), but at least some of that is simply a push towards increased casualization of the labour market.
So far, all of this is roughly consistent with what we saw Monday through Wednesday – which is that there was a one-time shock to employment around 2008, and that the effect is much more pronounced among younger graduates (say, those 6 months out from graduation ) than it is among older ones (say, those 24 months after graduation. What is not quite consistent, though, is what is happening to wages. Unfortunately, CANSIM no longer makes available any decent time series data on wages or income for the 20-24 or 25-29 age groups (one of these days I am going to have to stump up for a public use microdata file but today is not that day.) But it does offer some data on what’s going on for 15-24 year olds. Sub-optimal (25-29 would be best) but still useful. Here’s what that data looks like:
Figure 3: Hourly and Weekly Wages, 15-24 year-olds, in $2016, 2001-2016
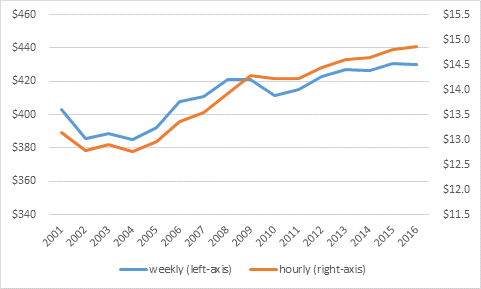
Figure 3 shows hourly and weekly wages for 15-24 year olds, in 2016 dollars. Hourly wages (measured on the right axis) grew faster than weekly wages (measured on the left axis) because average hours worked fell by 3.5% (this is the shift to part-time work we saw in figure 2). Hourly wage growth has not been as strong since 2008 as it was between 2004 and 2008, but it is still up 6% over that time. It’s probably safe to assume that the situation for 25-29 year olds is not worse than it is for 20-24 year olds. Which means we have an interesting puzzle here: wage growth for the youth cohort as a whole is positive, at least among those who have wages – but as we saw Monday and Tuesday wage growth is negative for university students. What’s going on?
There are two possibilities here. The first is that wage growth since 2008 is stronger for those without university degrees than it is for those with. With the oil/gas boom, that might have been a reasonable explanation up to 2014; it’s hard to see it still being true now. The second is the proposition advanced here earlier this week: that while university graduates may still all cluster at the right-end of the bell curve, as they encompass a greater proportion of the bell curve, the average as a whole necessarily falls.
In short: post-2008, something has happened to the labor market which makes it more difficult for young people to “launch”. We shouldn’t overstate how big this problem is: employment is down slightly, as is the proportion of employment which is full-time. But unlike previous recessions, the youth-labour market does not seem to be bouncing back – these changes seem to be permanent, which is a bit disquieting. But it’s also true that these effects are more severe among the youngest: which is exactly what you’d expect if the labour market was putting a greater emphasis on skills and experience. By the time youth get to their late 20s, the effects mostly disappear.
In other words, what we are seeing is less “failure to launch” than “delays in the launch”. To the extent anything has changed, it’s that the transition to the labour market is on average a little bit rougher and a little bit slower than it used to be, but that’s likely as much to do with the expansion of access to university as it is a skills-biased change in the labour market.


One Response
Alex – an intuitive thought/reponse to your post this am. I wonder how much the recession has impacted the “older” workforce with respect to retirement decisions? My experience with sorting the murky waters of labor market forecasting prior to 2008 vs post has seen a dramatic shift in the assumption of when one may retire (and thereby create the space for new grads to enter the workforce).