


Faithful readers will probably recall the “nutshell” series we produced last year (see here if you want to refresh your memory), in which we profiled 8 provinces’ post-secondary education systems before running out of time towards the end of the year, thereby disappointing some readers in Prince Edward Island and Saskatchewan. However, fear not! We’re going to finish up this month, starting out east with the Island.
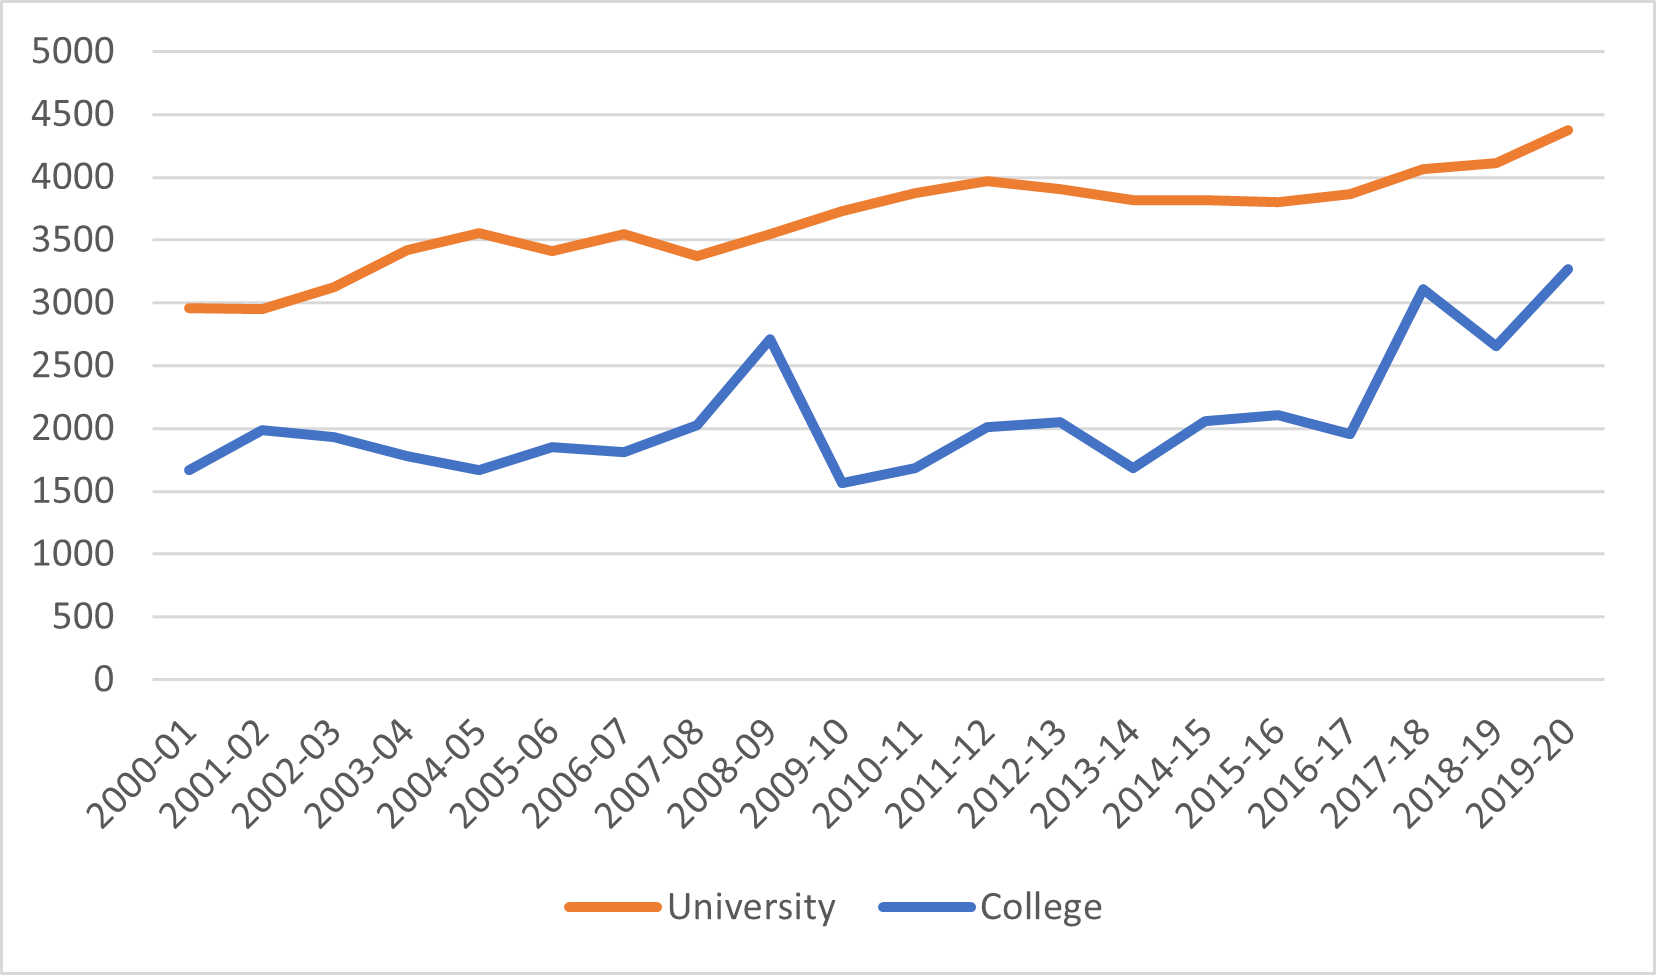
To begin with student numbers: Prince Edward Island is the only province in Atlantic Canada which has seen a significant growth in student numbers over the last two decades. Statistics Canada data indicate that the University of Prince Edward Island has grown nearly 50% since 2000, while numbers at Holland College have nearly doubled. As always with colleges, it is hard to be exact about growth rates since a substantial portion of the increase shown here was in fact due to changing Statistics Canada definitions of what constitutes “college” education and what constitutes “vocational education”, but clearly a substantial increase has occurred.
Figure 1: Full-time Equivalent Students, by Sector, 2000-01 to 2019-20
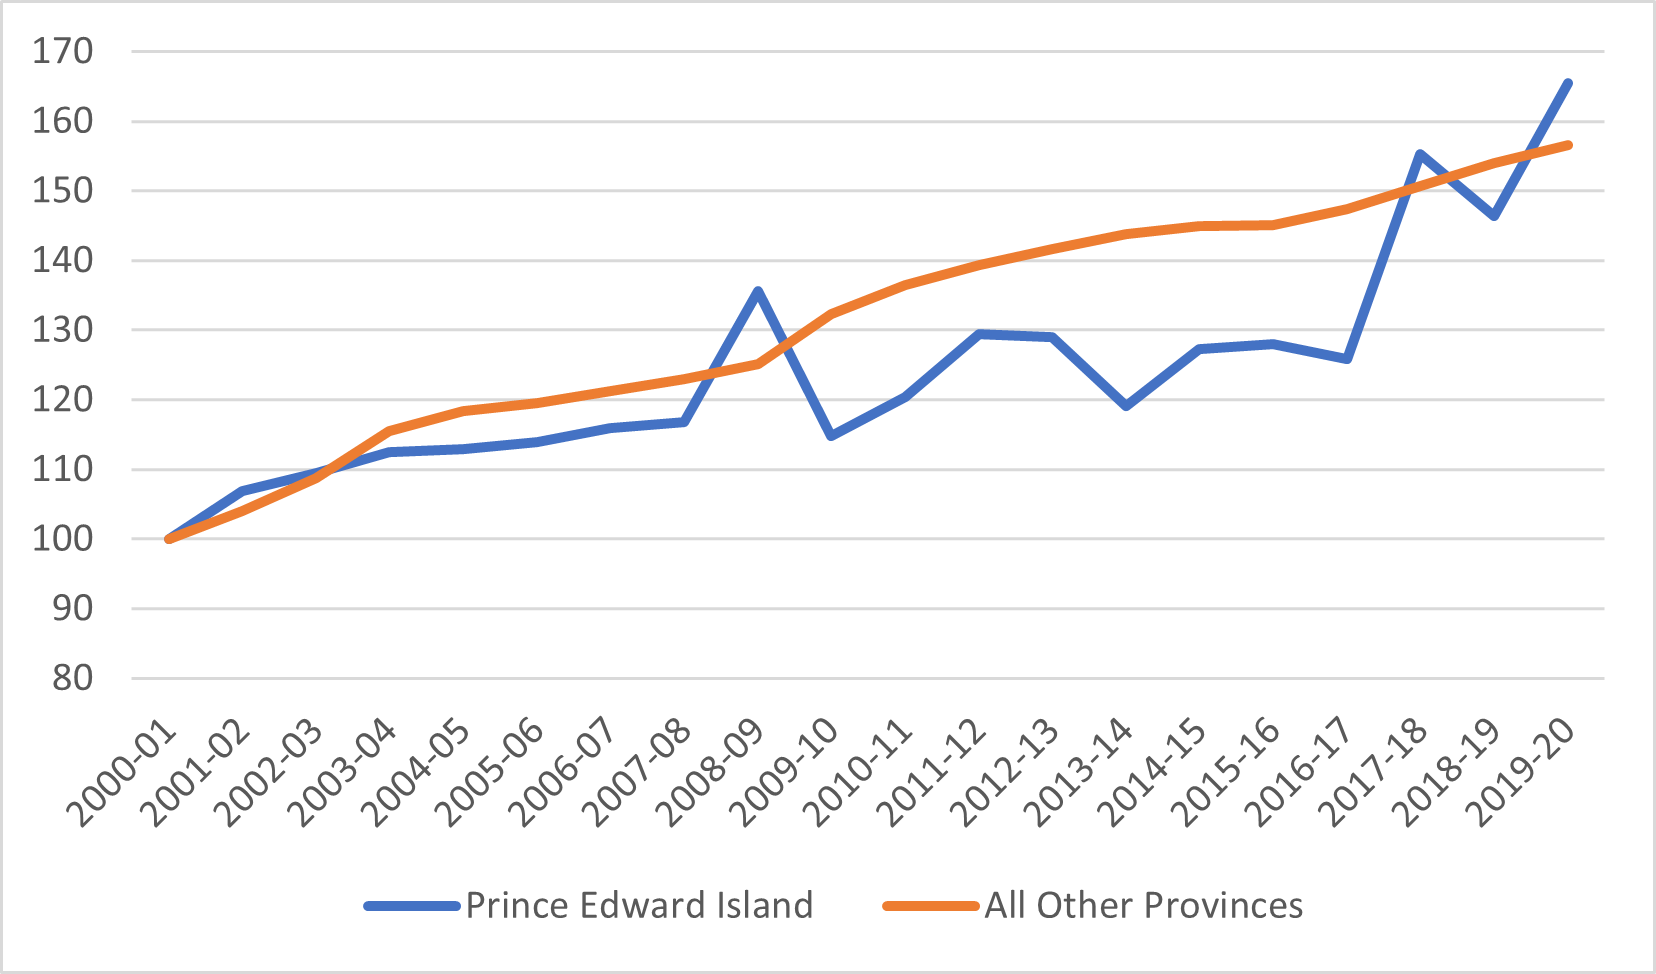
For much of the past decade, Prince Edward Island looked like the rest of the Atlantic provinces in that growth seemed to be lagging the rest of the country. However, since 2017, numbers have been rocketing upwards, so that by 2019-20, the province’s 66% growth rate in full-time equivalent students since the turn of the century places it slightly above the national average.
Figure 2: Indexed Full-Time Equivalent Post-Secondary Students, Prince Edward Island vs Other 9 Provinces, 2000-01 to 2019-20 (2000-01 = 100)
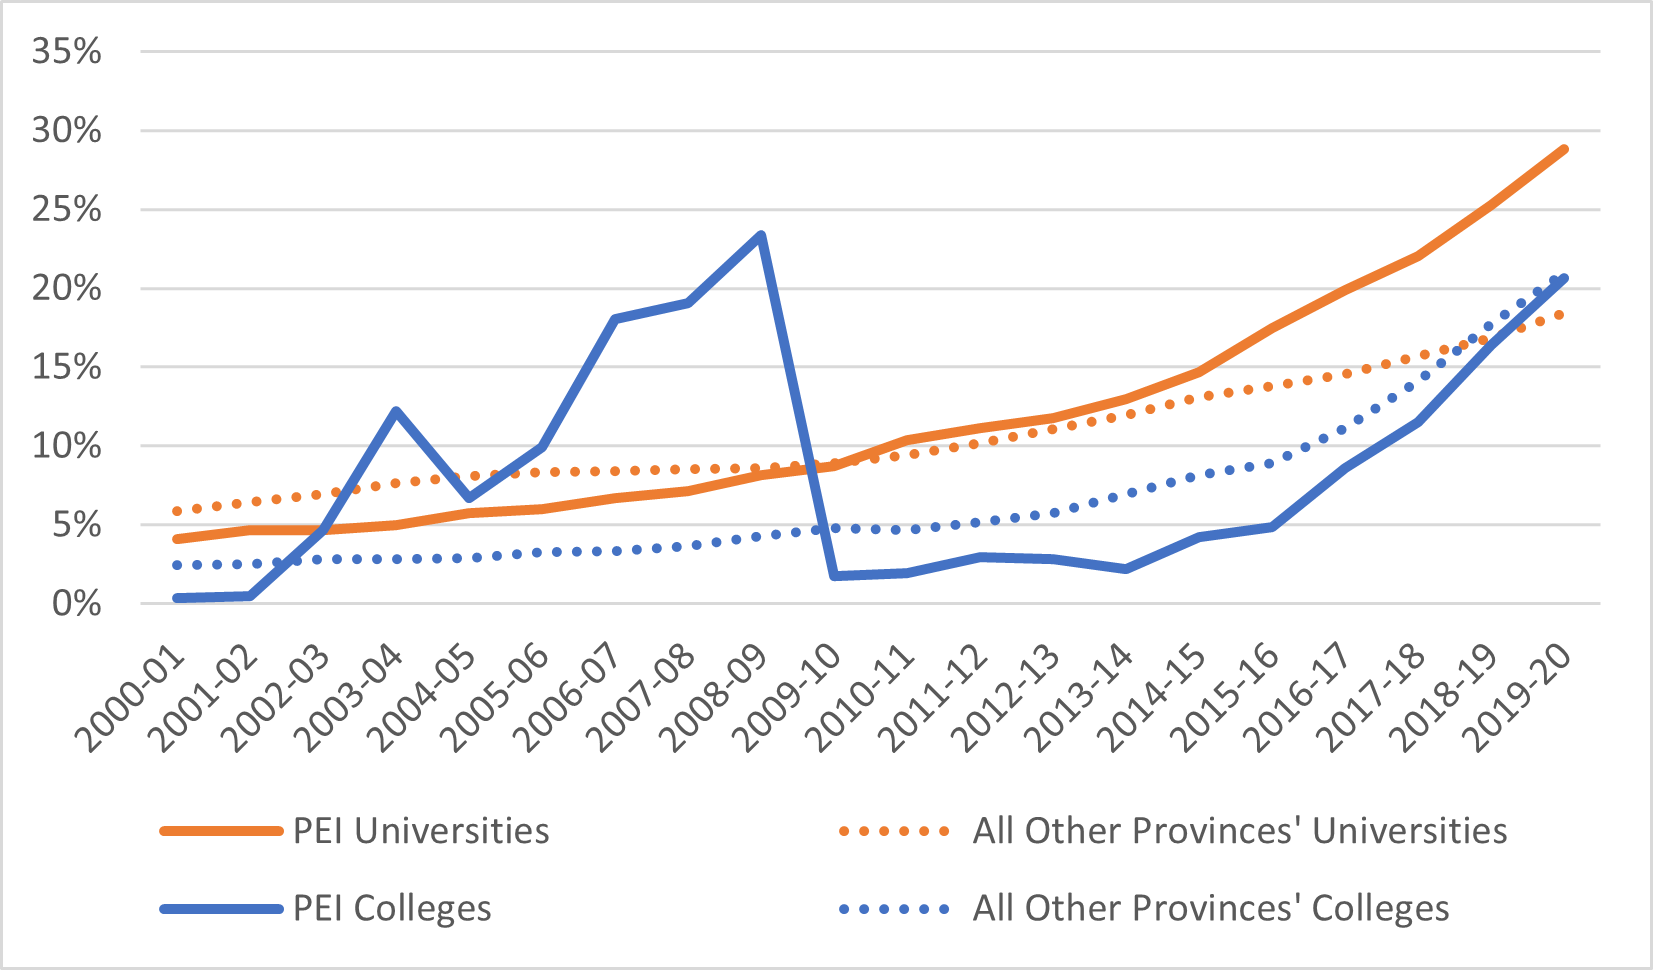
One of the key factors that has propelled recent growth in Prince Edward Island is an influx of international students. In 2009-20 there were about 400 international students in the province; ten years later there were over 1800 (it’s a small province, so small absolute numbers move averages substantially). Nearly 30% of university students on the island are now from outside Canada.
Figure 3: Proportion of Students from Outside Canada, by Sector, Prince Edward Island vs other 9 provinces, 2000-01 to 2019-20 (2000-01 = 100)
With respect to institutional funding, the most curious feature about Prince Edward Island is that despite the big increase in international student numbers, there has not been a major increase in student income. As a result, total revenues have flatlined even though student numbers are up, thus resulting in decreasing income per student over the long run.
Figure 4: Total PSE Institutional Revenue by Source, Prince Edward Island, 2000-01 to 2019-20, in millions of constant $2019
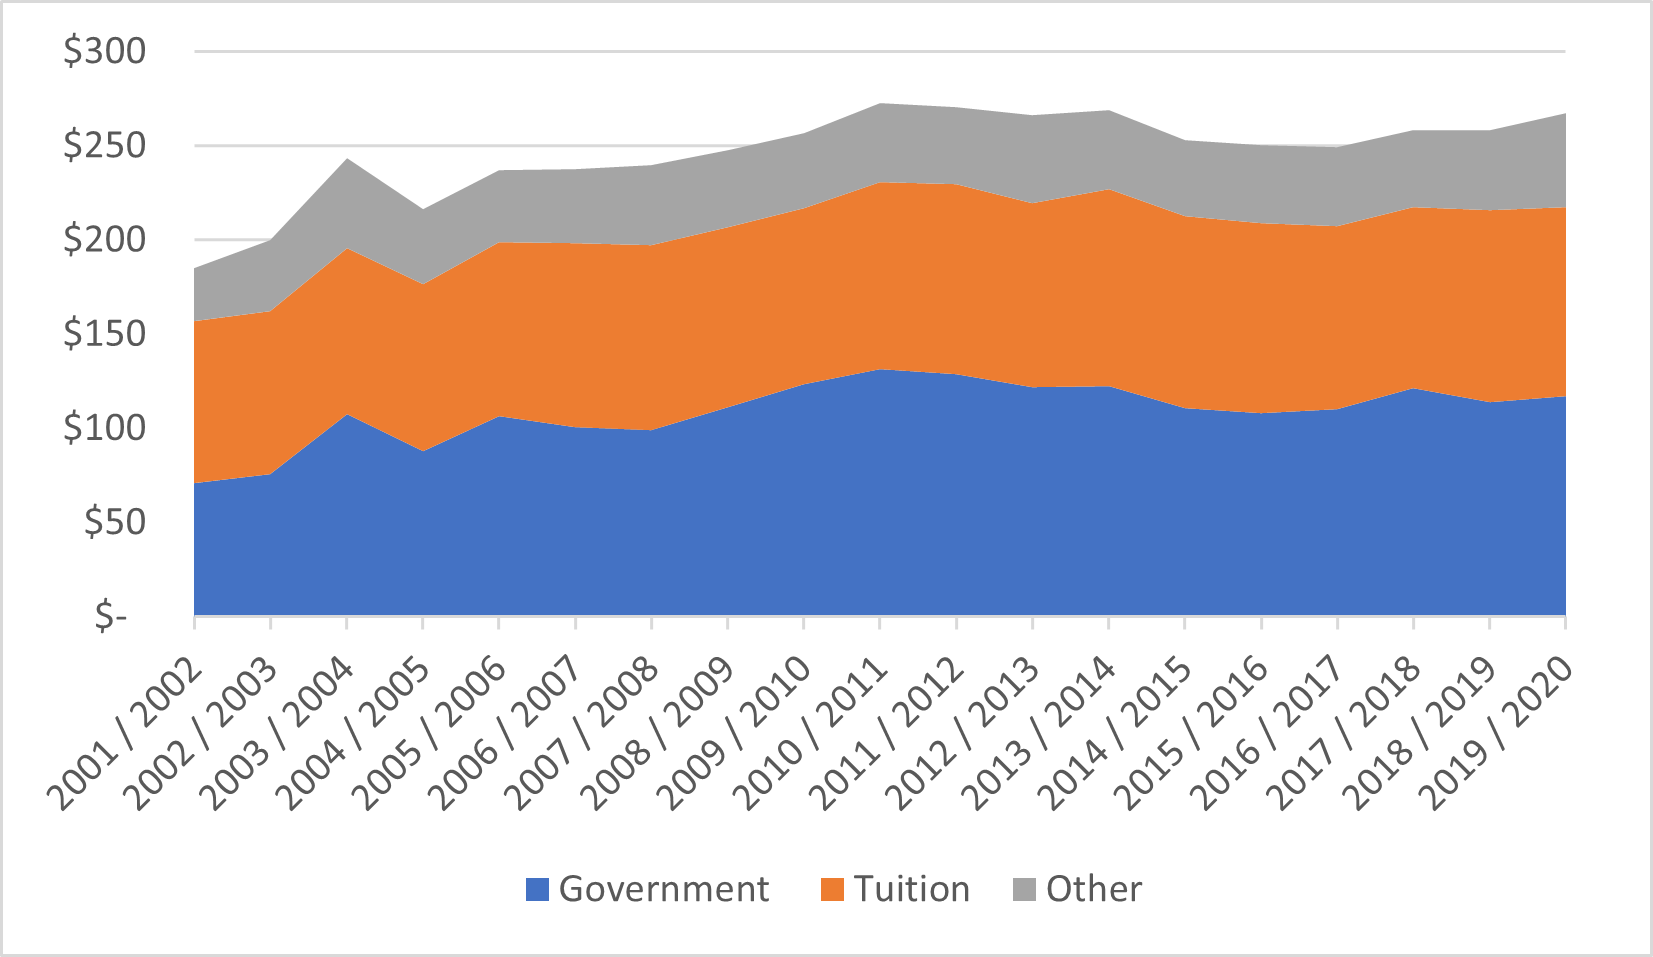
Figure 5 shows they key problem in more detail. The change in funding from government in Prince Edward Island has been very similar and indeed slightly better than that in the rest of the country. However, tuition revenues have lagged substantially, only doubling where in the rest of the country they have close to tripled. Yet, as figure 6 shows, this is not because the rate of increase of domestic tuition fees has been any lower than the national average. In fact, domestic fees on the Island have hugged the national average very tightly over the past 20 years. This may suggest that international fees are underpriced in Prince Edward Island.
Figure 5: Indexed Change in Institutional Income from Governments and Tuition Fees, Prince Edward Island v. Other 9 Provinces, 2000-01 to 2019-2020 (2000-01 = 100)
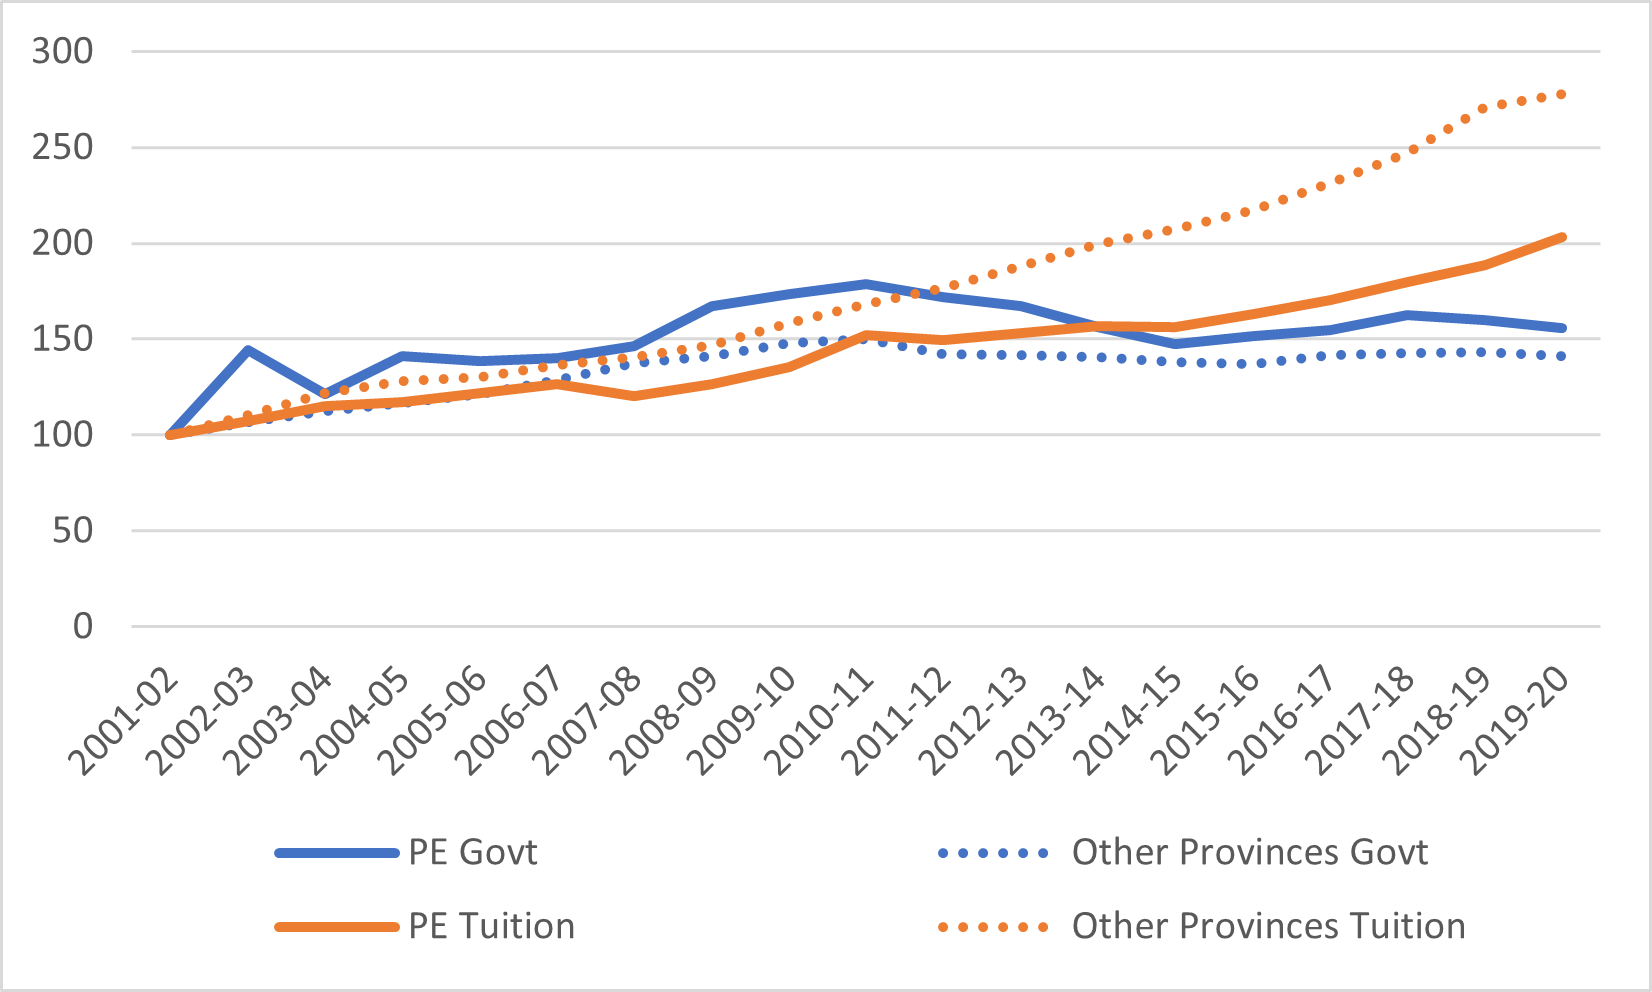
Figure 6: Tuition Fees, Prince Edward Island v. Canada, 2006-07 to 2021-22 (in constant $2021)
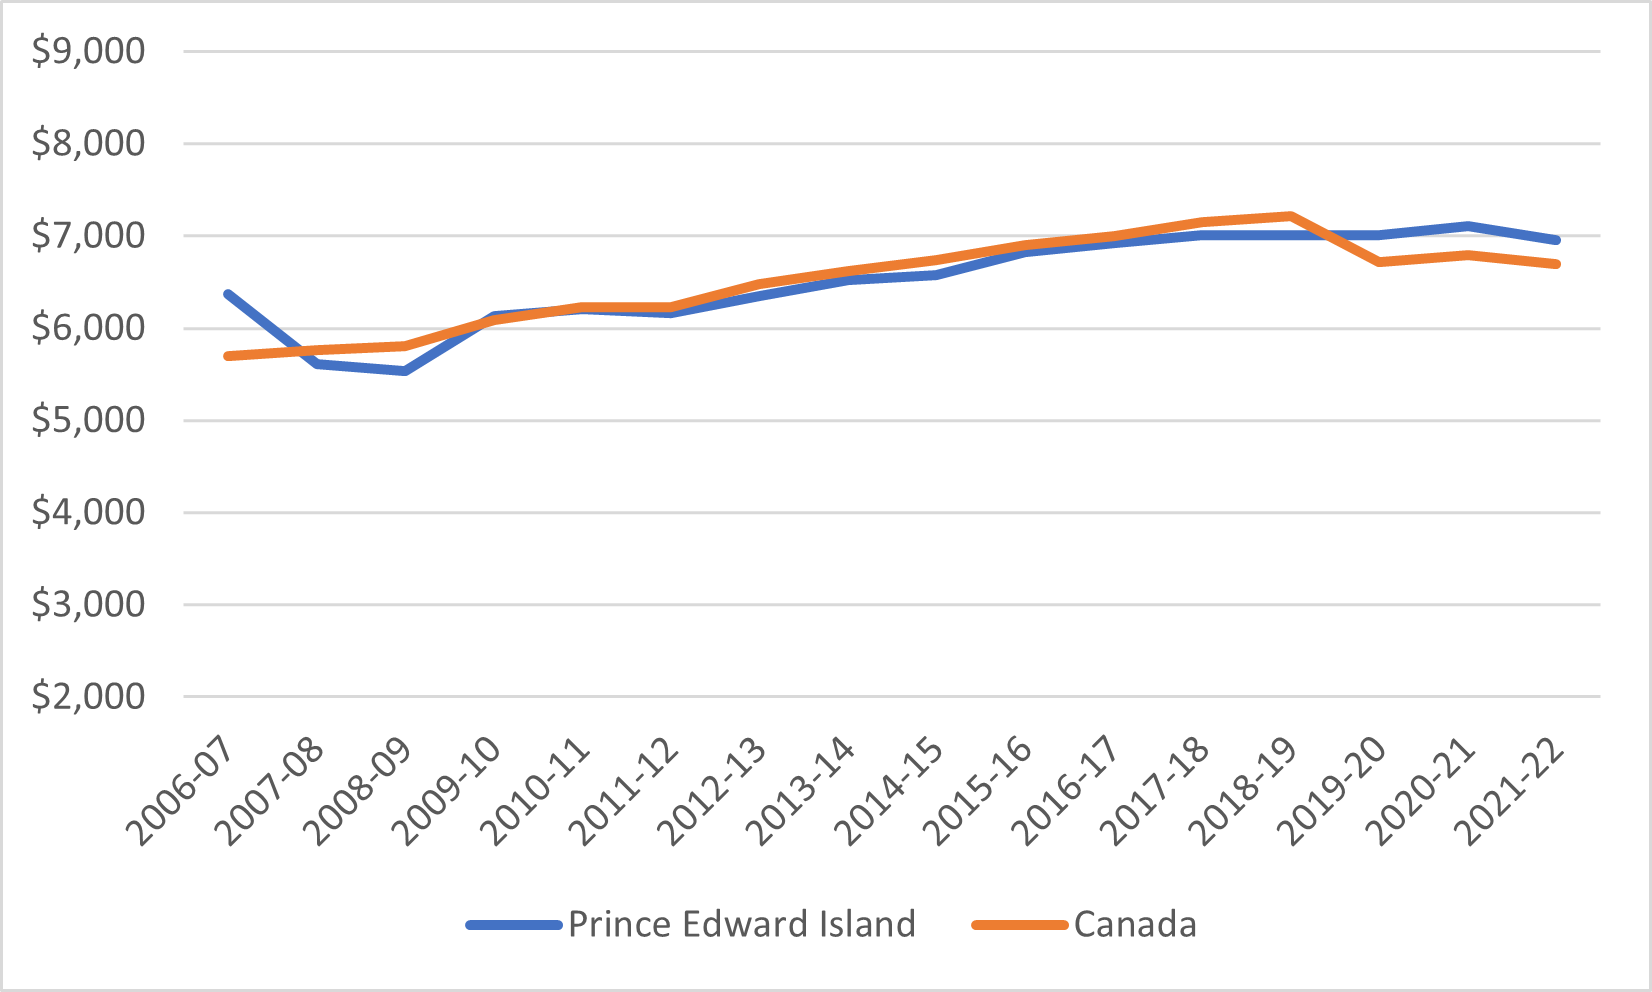
Figure 7 shows the average loan per recipient plus the average grant per recipient over time in Prince Edward Island, from both federal and provincial sources (this is not quite the same thing as an average aid package because not all loan recipients are grant recipients). According to this information, the total size of combined federal-provincial aid packages has remained more or less constant at about $11,000 in constant dollars. However, the loan portion has declined a bit from around $9,000 to just under $8,000, with grants making up the difference.
Figure 7: Average Loan Plus Average Grant Disbursed, Prince Edward Island, 2011-12 to 2019-20, in constant $2019
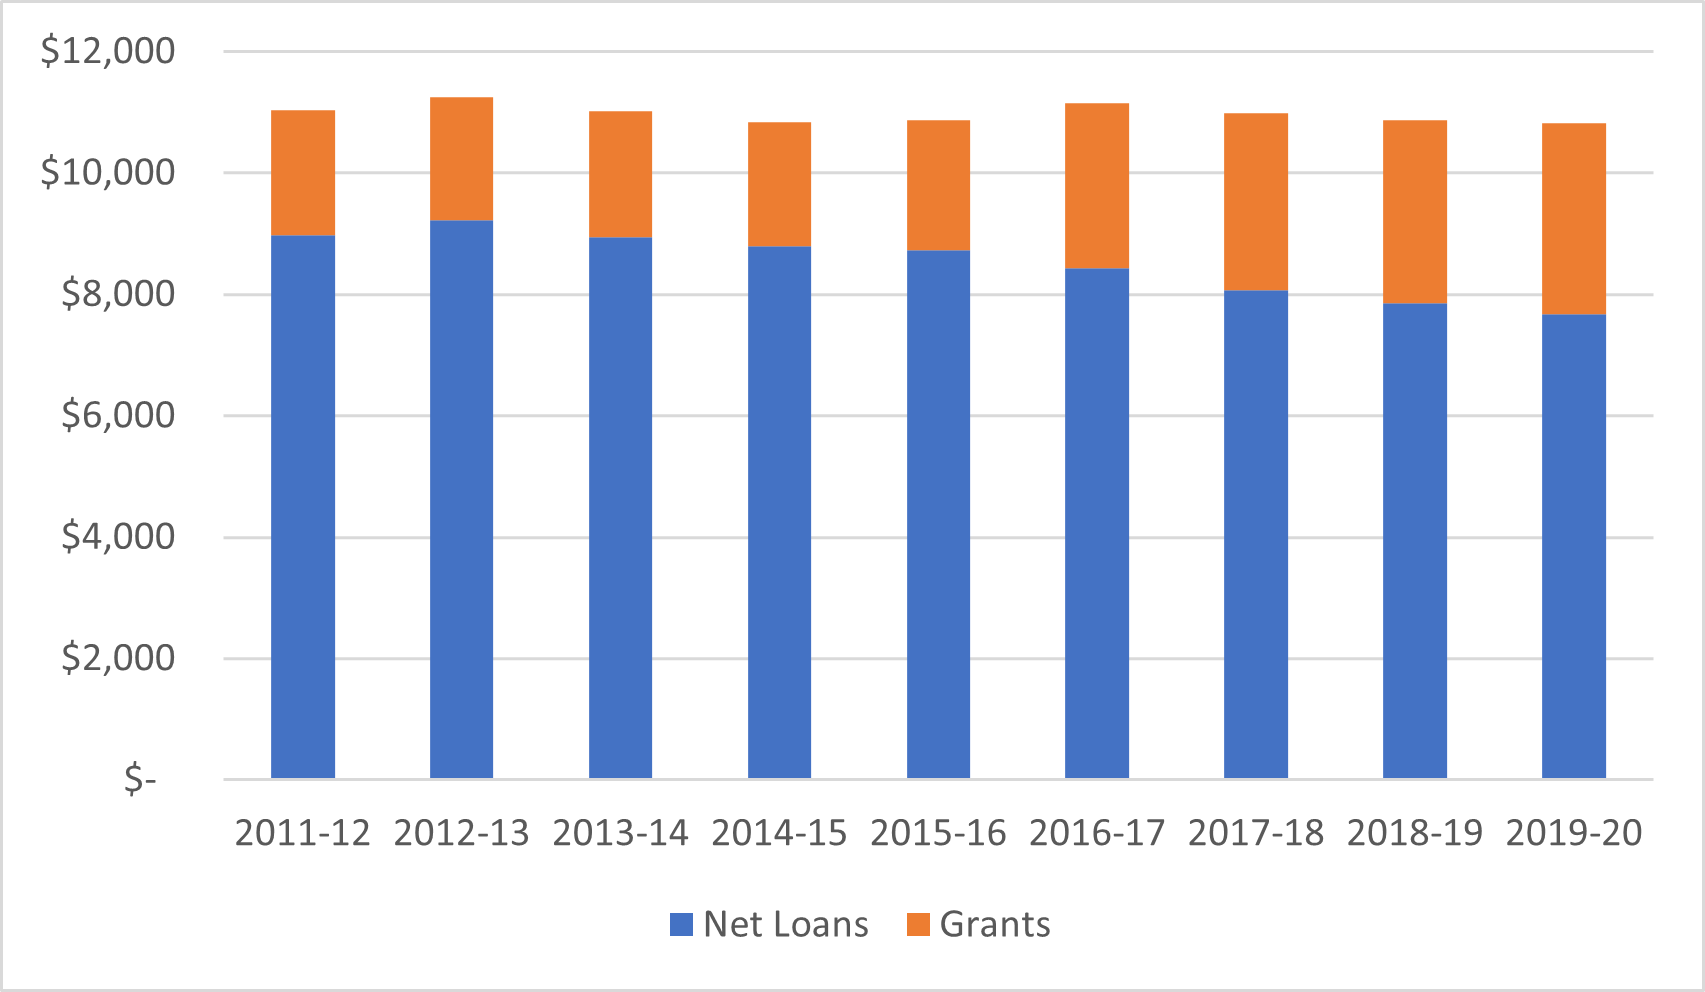
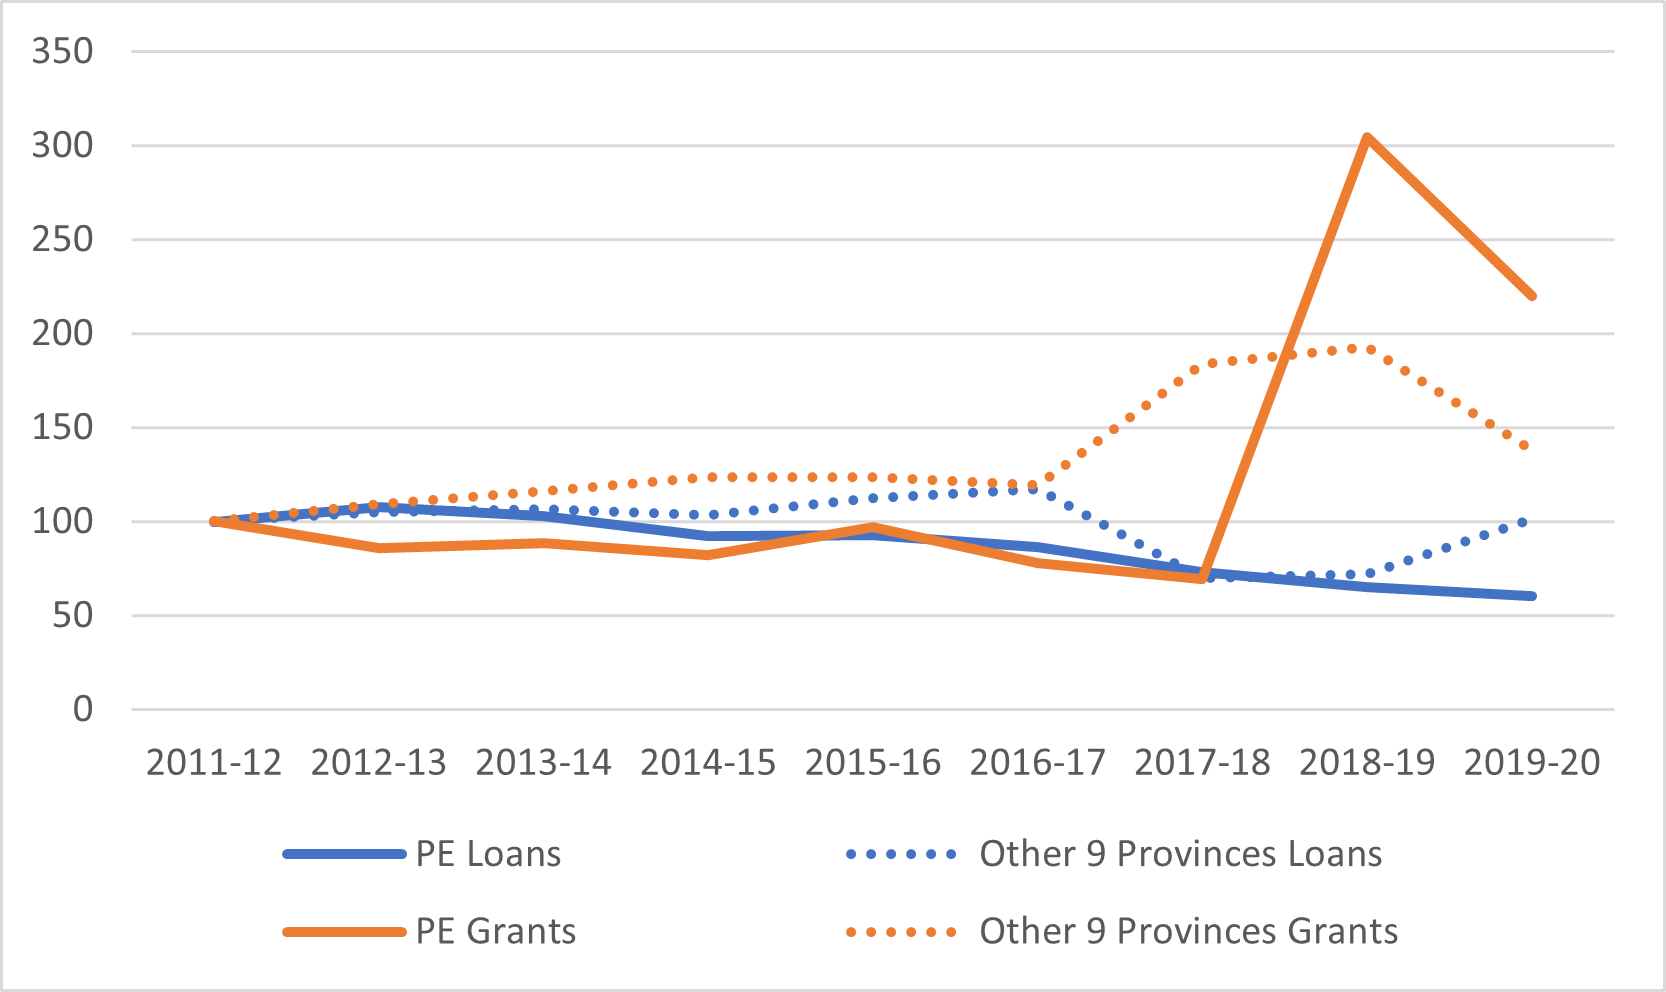
Figure 8 shows the change in distribution of provincial loans and grants (i.e. excluding Canada Student Loans) since 2011-12. Loans issued have been declining steadily for the better part of a decade, by about 40% in total. On the other hand, grants stayed relatively constant until 2018 when grants were suddenly tripled by the provincial government.
Figure 8: Indexed Change in Total Real Provincial Loans and Grants Disbursed, Prince Edward Island vs. Other 9 Provinces, 2011-12 to 2019-20 (2011-12 = 100)
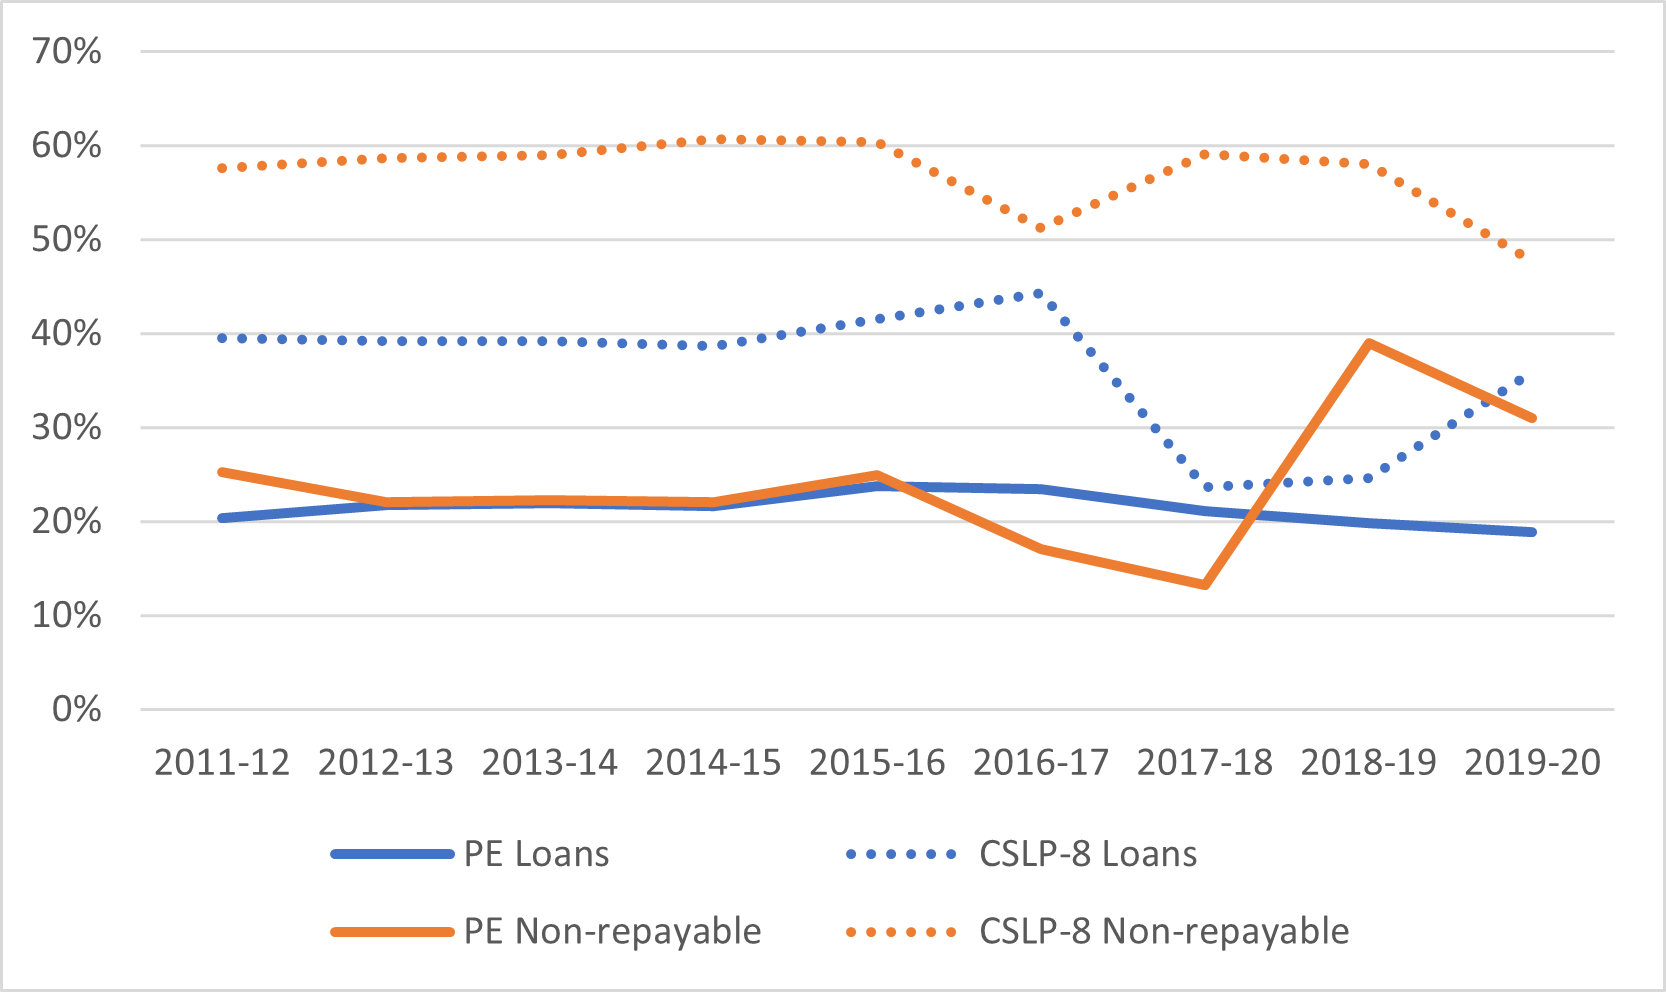
Finally, we can examine how much of the province’s student assistance comes from provincial as opposed to federal sources. For this exercise, we compare PEI to the other eight provinces which participate in the Canada Student Financial Assistance Program, because including Quebec would make this comparison a little bit strange. Prince Edward Island is more reliant on the federal student aid program than are most other provinces. Even with the recent large increase in grants, the provincial portion of all grants distributed in the province is just 30%, compared to 50% in the rest of the CSFAP-area. Similarly, provincial loans are only about 20% of all loan disbursements, compared to about 40% elsewhere.
Figure 9: Provincially-Funded Loans and Grants Disbursed as a Percentage of Total Loans and Grants Disbursed, Prince Edward Island vs. 8 other Canada Student Financial Assistance Program Provinces, 2011-12
So, that’s the ninth of our series done: come back next week for the final installment, on Saskatchewan.

